
Aeroacoustic Excitation of Acoustic Resonance
|
Aeroacoustic Excitation of Acoustic Resonance
|
During the course of research, sound generated through the aeroacoustic driving of a Helmholtz resonator was investigated. Helmholtz resonators consist of a large cavity of air connected to a smaller diameter neck. Acoustic resonance of this system can occur when air is blown over the open neck of the resonator for a particular range of velocities. A glass pipe wind tunnel with two Helmholtz resonators connected perpendicular to it was built to explore this phenomenon. The flow velocities in the wind tunnel were varied and the frequencies of oscillation and acoustic pressure inside the flask were recorded. The vortices that are shed at the opening of the neck of the Helmholtz resonator resemble a driving force. This system simulates that of a driven, damped harmonic oscillator where the air in the volume of the flask behaves like a spring, while the air in the cross section acts like a mass.
|
|
|
|
|
|
Usually space hardware is created before thinking about the amount of noise it will produce. An example of this is the Minus Eighty-degree Laboratory Freezer (MELFI) for the International Space Station (ISS) payload rack. Its original design did not comply with sound requirements. The flight rack underwent several hardware changes to reduce the noise it produced. Another example is the Functional Cargo Block (FGB), the first element of the ISS to be placed in space. Its’ air filtration system was creating a lot of noise. A muffler had to be created to dampen the noise from the fans. My objective was to explore acoustic resonance inside Helmholtz resonators excited by gas flow over a cavity at around one atmospheric pressure. By knowing more about what causes noise, quieter equipment can be created.

Helmholtz resonators consist of a large cavity of air connected to a smaller diameter neck. A familiar example is a Coke bottle. You all know that when you blow over a Coke bottle, you can create sound. The same is true for my Helmholtz flask. Acoustic resonance occurs inside this system when air is blown over the open neck of the flask. And just like with a Coke bottle, if you blow too hard or too soft, the resonance does not occur. It is the shedding of vortices around the neck opening of the flask that excites resonance. Here is a video of what vortices look like:
|
|
In this video, the air in the wind tunnel at the bottom of the image blows from right to left. The vortices form at the right hand corner where the neck, at the top of the image, meets the wind tunnel. As the vortices build they are pushed into the neck. The air from the neck is then pushed into the flask (which is at the top outside of this image). The air in the flask pushes back on the air in the neck which pushes the vortices out of the neck and on down the wind tunnel. Then another acoustic cycle begins. |

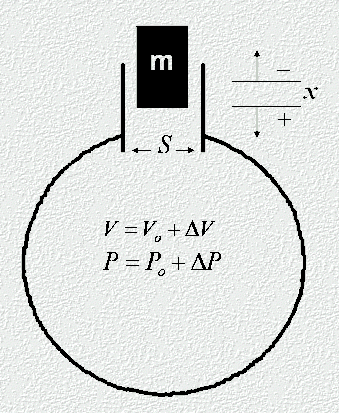
Air blows through the wind tunnel (mean flow) in this picture from right to left. As the air flows over the neck of the flask the vortices form where to neck meets the wind tunnel. As these vortices build in the neck they drive the “mass” of air from the neck into the flask. Like a spring, the air in the flask must compress as the mass of air from the neck pushes on it. When the air in the flask is compressed as much as possible, the air from the neck can push no farther into the flask. The air from the flask pushes back on the air from the neck, moving it back toward the wind tunnel. As this happens the vortices are pushed out of the neck and continue to travel down the wind tunnel. Then, the acoustic cycle begins again with another vortex building at the neck.
|

The glass piping is about 5 cm in diameter. Originally used as drainage pipe for a chemistry lab, it was scavenged last summer when Dr Slaton and I renovated the lab. I built wooden stands to hold the piping up level with the cavity of the flask. I attached two 5 L resonators 80 cm apart. They are perpendicular to a 175 cm long wind tunnel. The wind is created by a shop vac (attached below the bottom of this picture) which is attached about 85 cm from the cross junction. The open end of the tunnel (at the top of this picture) is about 90 cm from the cross junction. A water manometer is attached to the system to allow me to measure the pressure of the air flow from which I calculated the wind flow velocity. I also attached a thermometer. A calibrated microphone suspended inside the flask was used to record the frequencies and amplitudes of oscillation. |
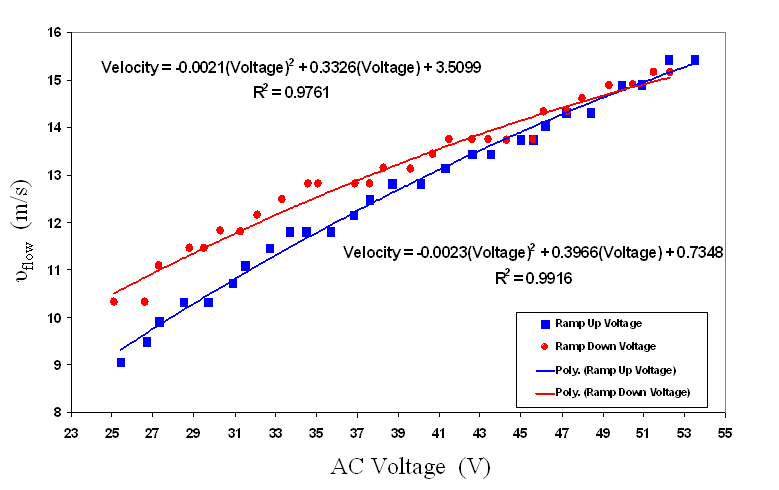
To calibrate the Shop Vac, I varied the AC voltage and recorded the change in height from the water monometer. Using this measurement, I calculated the pressure of the air flowing through the wind tunnel. I also measured the temperature of the air flow. With the pressure and the temperature of the air flow, I calculated the density of the air inside the wind tunnel using the Ideal Gas Law. With the temperature, pressure, and a little help from Bernoulli, I calculated the velocity of the air flow. The flow velocity range for which sound is excited is 9 to 16 m/s which is about 30 to 53 ft/s or 20 to 36 mph. And as you can see, there is a difference in the velocity for when the voltage was increased and when it was decreased. I am not sure why this happened.
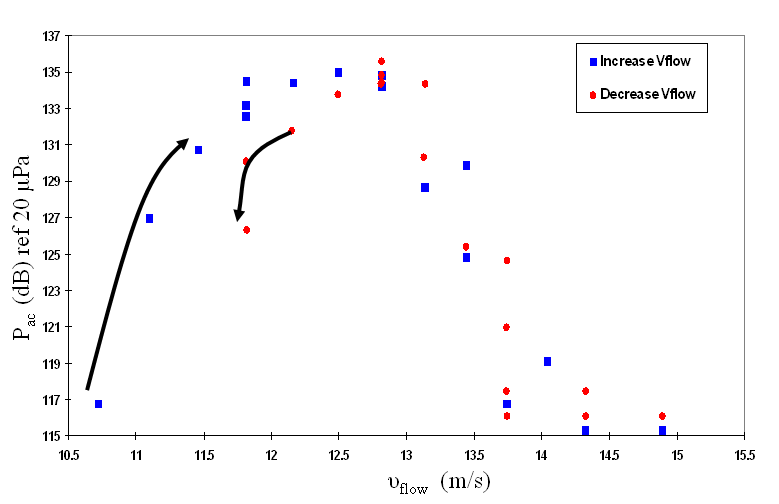
The x axis is the velocity of the air flowing through the wind tunnel perpendicular to the Helmholtz flask. The y axis is a measure of the pressure inside the flask. It is measured in decibels. As a comparison, a jet engine from a 100 feet away creates 140 dB, and pain begins around 125 dB. Though I could not hear the system resonating, I could feel the vibrations by placing my hands on the flask. You can see in the graph that when the flow velocity is too low or too high, there is no resonance. This matches our qualitative explanation that if you blow too soft or too hard over a Coke bottle the sound does not occur.
My next task was to find a relationship between the pressure in the flask and the acoustic velocity (the velocity of the air in the cross junction).
 Assuming sound is an adiabatic process in which no heat is transferred to or from the system as the pressure of the gas changes,
 Differentiating both sides gives: 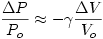 (1) (1) The change in the volume is the cross sectional area times the displacement of the mass of air in the neck.  This quantity is negative because for a positive displacement, the final volume is less than the initial volume. Substituting and  back into equation (1) and rearranging gives an equation for the acoustic pressure as a function of the displacement of the mass of air in the neck. back into equation (1) and rearranging gives an equation for the acoustic pressure as a function of the displacement of the mass of air in the neck.
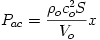 (2) (2)
Acoustic velocity is the time rate of change of the displacement.  Assuming a sinusoidal solution because the system is oscillatory leads to a solution of the form  Differentiation gives 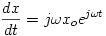 For a spring mass system the position is 90 degrees out of phase with the velocity. This accounts for the complex part of the solution. Taking the magnitude gives the acoustic velocity equal to the angular frequency times the displacement.  Plugging this back into the equation for acoustic pressure (2) gives 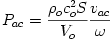 and rearranging this gives an equation for the acoustic velocity as a function of the acoustic pressure for the Helmholtz resonator.  Now that I have the acoustic velocity, I can create a dimensionless graph. This is important because the graph is true for all set ups with dimensions proportional to the experimental set up I used. |
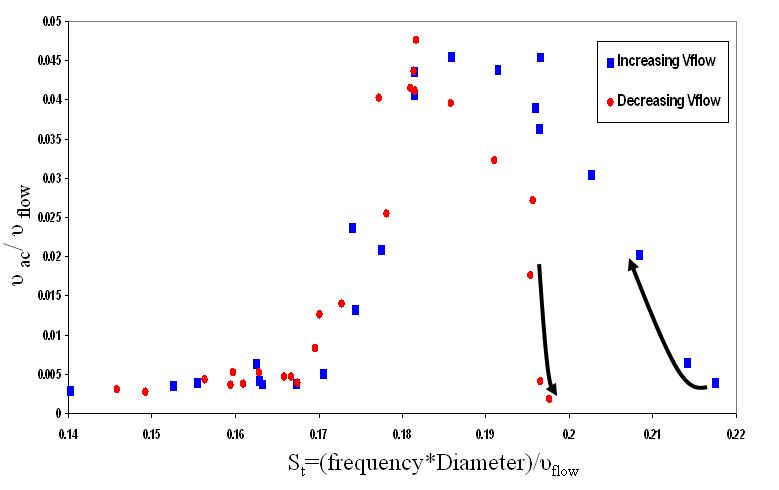
By divided the flow velocity into the acoustic velocity, the y axis becomes dimensionless. The relationship between the acoustic velocity and the flow velocity is important because where the two velocities interact is where the vortices are created. You can see that at its maximum the acoustic velocity is around Ľ the flow velocity. So for a flow rate of 12 m/s the acoustic velocity is 3 m/s. The Strouhal number is on the x axis. For a Strouhal number around .18 resonance occurs in the system. What is nice about the Strouhal number is that if you change the dimensions of the system, resonance will still occur at a Strouhal number around .18.
This work has been presented at:The Johnson Space Center Acoustics Office |
Funding for this research was made possible by grants from: |
|
Fifteenth Annual Arkansas Space Grant Symposium |

|


