Thermoacoustic Quality Factor Enhancement
Space Grant No. UCA16077
September 20, 2006 - April 14, 2007
Thermoacoustic Engines
When heat is put into a thermoacoustic engine, the engine produces work in the form of
sound with a certain amount of waste heat rejected into the cooler environment. A
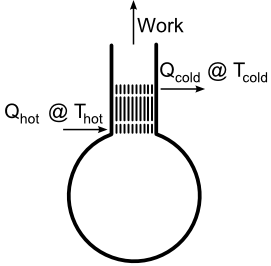
thermoacoustic engine can be constructed from a Helmholtz flask (shown right) by
inserting a porous stack into the bottom portion of the neck of the flask and applying heat to one side of the
stack. If the temperature difference across the stack is great enough, then the engine
will produce sound. The moment at which sound is produced is called onset.
|
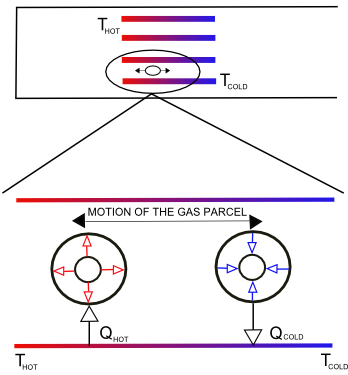
Consider a thermoacoustic engine made of an open-closed pipe (shown left). If there is
no temperature difference across the stack, a parcel of gas located within the stack will
oscillate back and forth due to pressure and velocity changes caused by the standing wave
inside the pipe. If heat is applied to one end of the stack, then the parcel will now be
involved in heat transfer. If the parcel is cooler than the hot end of the stack, it will
absorb heat energy and thermally expand. As it travels down the stack, the gas parcel will
transfer its heat energy to the cooler stack and contract. This gas parcel along with its
neighbors will act as a bucket brigade, transferring the heat energy from the hot end to the
cooler end of the stack. The net work of the gas parcels will provide the standing wave with
acoustic power, and if the temperature difference across the stack is great enough, the engine
will produce sound. Because there are pressure and velocity changes inside Helmholtz resonators, it is possible
to create a thermoacoustic engine from a Helmholtz resonator based on these principles. |
Helmholtz Resonators
The gas inside a driven Helmholtz flask will experience mainly
pressure oscillations towards the bottom and velocity oscillations towards the opening of the flask.
The air oscillating in the neck of the Helmholtz flask acts as the mass whereas the air that oscillates
in the cavity acts as the spring. The oscillating air in the neck will experience resistance in the form of friction
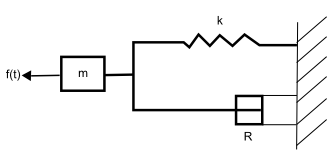
due to rubbing against the sides of the neck. Therefore, a Helmholtz resonator is comparable to a driven, damped spring-mass system
(shown left). R is the resistance in the system, k is the spring constant, m is the mass, and f(t) is the
sinusoidal, driving force. The motion of the mass can be described by the second-order differential
equation for a driven, damped spring-mass system. |
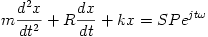
This equation is Newton's Second Law, in which the net sum of the forces acting on the oscillating
air in the neck is equal to its mass multiplied by its acceleration. x refers to the displacement of the mass.
The first term on the left is the mass multiplied by the acceleration. The second term on the left is the force due to resistance, which is assumed to be linear with velocity, and the third term is the force exerted by the oscillating air in the volume. The term on the right-hand side of
the equation is the sinusoidal driving force of the mass as a function of time. We assume the solution to this
differential equation has the form

Inserting this solution into our differential equation yields
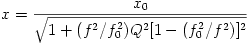
Here, x refers to the displacement of the mass, xo refers to the maximum displacement of the mass at resonance, and f refers to the
frequency at which the spring-mass system is being driven. Rather than measuring the displacement of the mass for a driven
Helmholtz flask, this experiment measures the pressure changes occuring in the flask. The pressure in the flask is related to the displacement by the equation
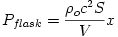
where Pflask is the pressure in the flask, ρo is the density of the air, c is the
speed of sound, S is the cross-sectional area of the neck, V is the volume of the cavity, and x is the displacement of the of the mass. In this experiment we are concerned with the ratio of pressure to the maximum measured pressure. This ratio eliminates the factor that is multiplied by the displacement to receive pressure, and the solution to the differential equation can be rewritten as
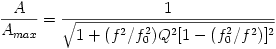
where A is the amplitude of the pressure signal recorded by the microphone and Amax is the maximum amplitude.
The two coefficients, f0 and Q, are the resonance frequency and the quality factor.
The resonance frequency is defined as:

or
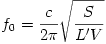
The first definition of resonance frequency is for a spring-mass system, where k is the spring constant and
m is the mass. The second definition is for a Helmholtz resonator, where S is the
cross-sectional area of the neck, L' is the effective length of the neck, which is the length of the neck plus 1.5 times the radius of the neck, and V is the volume of the
cavity. The quality factor is defined as:

In this definition for the quality factor, ωo is the angular resonance frequency,
m is the mass, and R is the resistance of the system. In this experiment the quality factor is simply
a means of describing the width of the resonance peak.
Experimental Setup
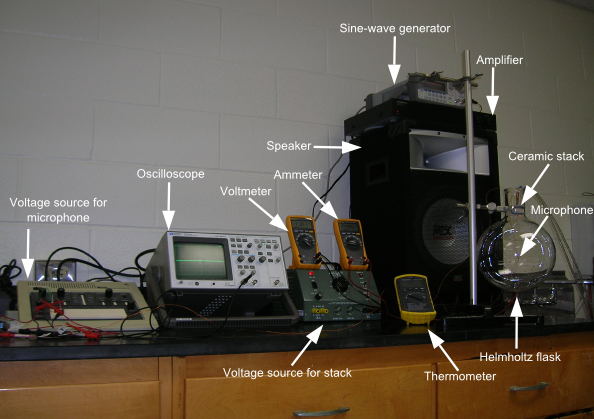
Our research focused on the response of a thermoacoustic engine made of a Helmholtz flask as it was driven by an external
harmonic driving force for different temperature differences across a porous ceramic stack.
A 5-liter Helmholtz flask was driven over a range of frequencies with the use of a sine-wave generator,
an amplifier, and a speaker. A microphone, placed in the center of the cavity, measured the pressure
changes that occured within the flask as the flask was swept over a range of frequencies. The microphone's
measurements were displayed on an oscilloscope, which yielded the peak-to-peak voltage of the signal as
well as the frequency. Two power sources were used in the setup, one of which was used to provide the
microphone with power. The other source would eventually provide power to a ceramic stack located in the
bottom portion of the flask's neck.
Resonance Curve- Empty Flask
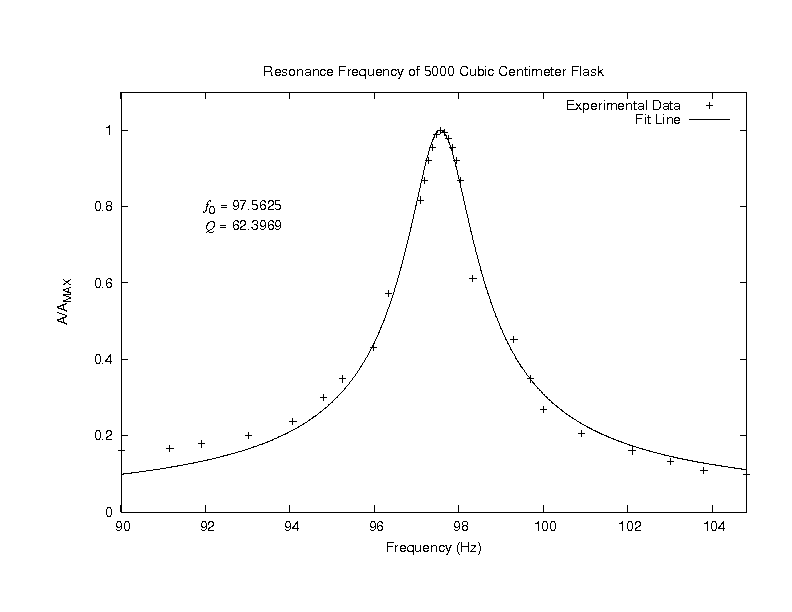
The empty 5-liter Helmholtz flask was swept over a range of frequencies. This graph displays the
the ratio of pressure amplitudes to the maximum pressure amplitude on the y-axis and the range of frequencies
on the x-axis. The data points are fitted to the solution of the second-order differential equation for the
driven, damped spring-mass system. According to the resonance frequency equation for a Helmholtz flask, the
resonance frequency is calculated to be 97 Hz. As shown from the graph, the microphone measures maximum pressure when the
flask is subjected to ~97 Hz. The quality factor for this resonance curve was determined numerically
to be ~62. This large quality factor corresponds to a fairly sharp peak in the resonance curve.
The Ceramic Stack
After sweeping the empty 5-liter Helmholtz flask through a range of frequencies and verifying the analogy
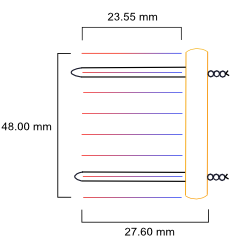
of the Helmholtz flask to a driven, damped mass-spring system, a ceramic stack with 324 pores per square inch was introduced
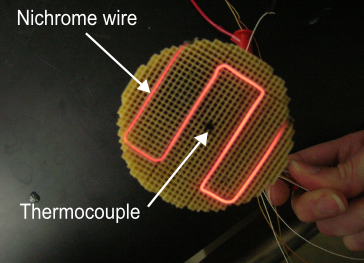
into the bottom portion of the Helmholtz flask's neck. On the left is a picture of the bottom of the ceramic
stack. The bottom of the stack was wired with nichrome, and a thermocouple located in the center pore
measured the temperature of the bottom of the stack.
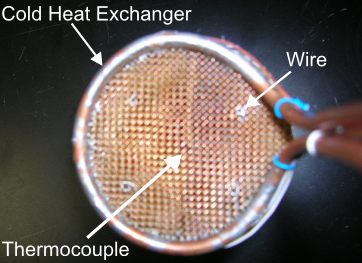
In the middle is a picture of the top of the stack with the cold heat exchanger. A cold heat exchanger
provided the system with large temperature differences between the top and bottom of the stack.
The cold heat exchanger was made of a copper tube soldered to copper netting. Cold tap water was fed
through the tube during the course of the experiment. The cold heat exchanger was adhered to the stack
with four small wires, and special care was taken to avoid any contact between these wires and the nichrome wire
located on the bottom of the stack. Another thermocouple, located in the center pore underneath the cold heat
exchanger, measured the temperature on this side.
Resonance Curve- Flask with Ceramic Stack
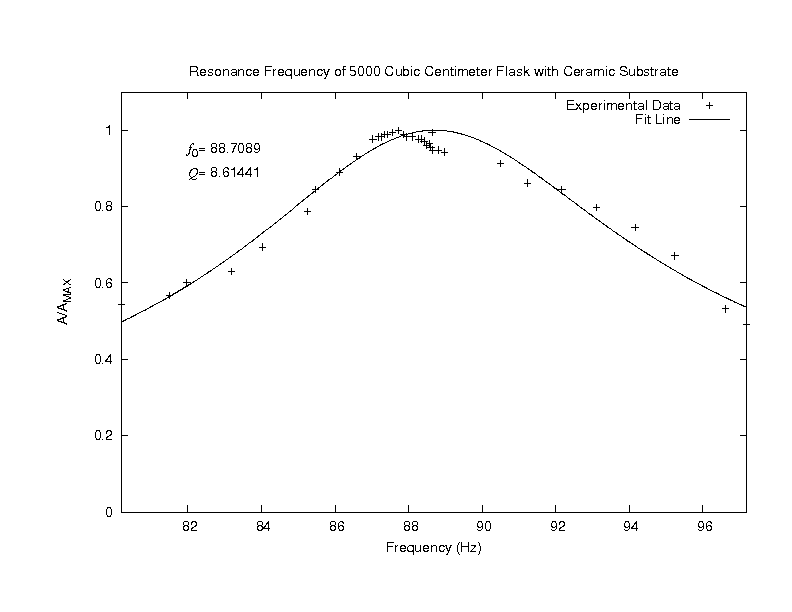
After inserting the stack into the lower potion of the Helmholtz flask's neck, the system was once again swept through
a range of frequencies with no temperature difference being applied to the stack. The graph shown above represents the
resonance peak of this system. The most obvious difference between this graph and the resonance graph for the empty
flask is the broadness of the peak. Inserting the stack into the flask's neck caused the quality factor to
significantly decrease thus indicating a broad resonance curve. Assuming that the mass of our system (the air oscillating
in the neck) has not changed significantly and remembering that the quality factor is inversely proportional to the resistance
of the system, one assumes that the introduction of the stack into this system has caused an increase in the system's resistance.
This makes sense because the introduction of the stack into the flask causes the air oscillating in the neck to experience greater
friction due to contact with the stack.
The resonance frequency has decreased as well from its value of 97.56 Hz for the empty flask. From the
equation for a Helmholtz flask's resonance frequency, one sees that both the effective length and the volume of the flask has not
changed; however, the insertion of the stack has decreased the neck's cross-sectional area thus decreasing the system's resonance
frequency.
Applying Temperature Differences Across the Stack
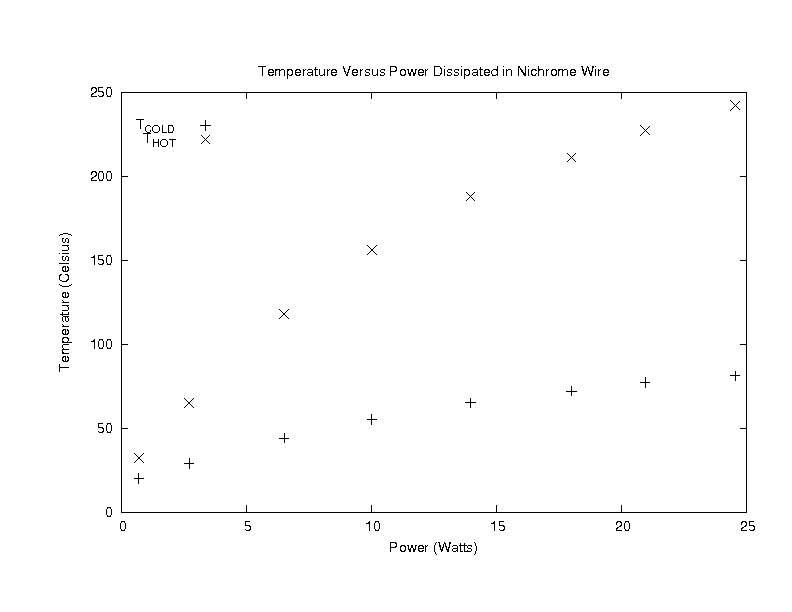
After observing how the insertion of a stack affected the system's resonance curve, the next step was to investigate
how increasing the temperature difference across the stack would affect the system's response. The above graph shows the temperatures
for the sides of the stack with the hot and cold heat exchangers versus the power dissipated by the nichrome wire. From this graph one notices
that the cold heat exchanger wasn't able to provide the system with a constant temperature, and future investigations will focus on exploring
other alternatives for cold heat exchangers. After increasing the power for each data set, the system was allowed to equilibriate and the flask
was driven through a range of frequencies for each temperature difference. For each set of data taken, an increase in both the resonance frequency
and the quality factor was observed.
Resonance Curve at ΔT=161o Celsius
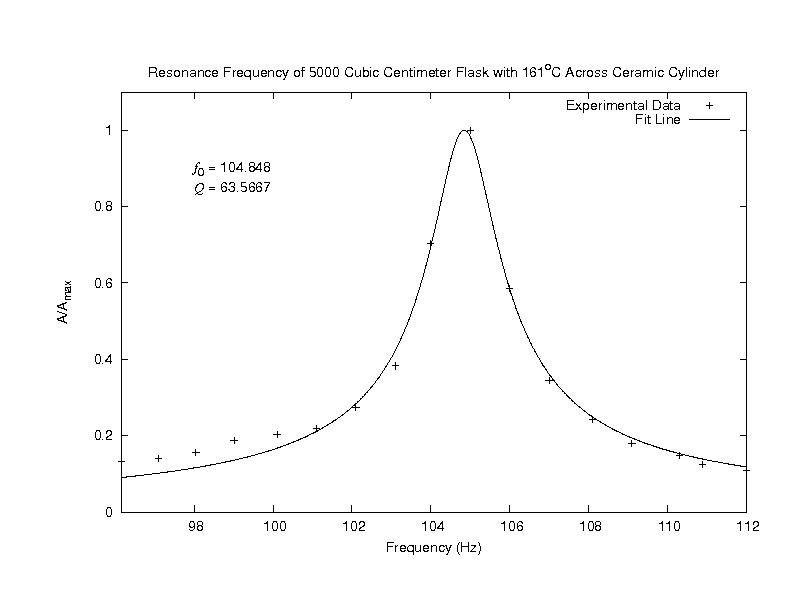
At a temperature difference of 161o Celsius, the system began to show signs of onset. A resonance curve for this system is shown above. As
shown by the graph, the resonance peak has sharply increased indicating a higher quality factor and hence a lower resistance. The quality factor has returned to and even exceeded
its value for that of an empty flask.
However, unlike the graph for an empty flask, the resonance frequency is not the same. Remembering the equation for the resonance frequency
of the Helmholtz flask, one recalls that the resonance frequency is directly proportional to the speed of sound. For the empty flask the speed of sound
was assumed to be 343 m/s (for air at room temperature). Because the stack introduces heat into the system, the temperature and the speed of sound have
increased leading to an increased resonance frequency.
Quality Factor and Resistance
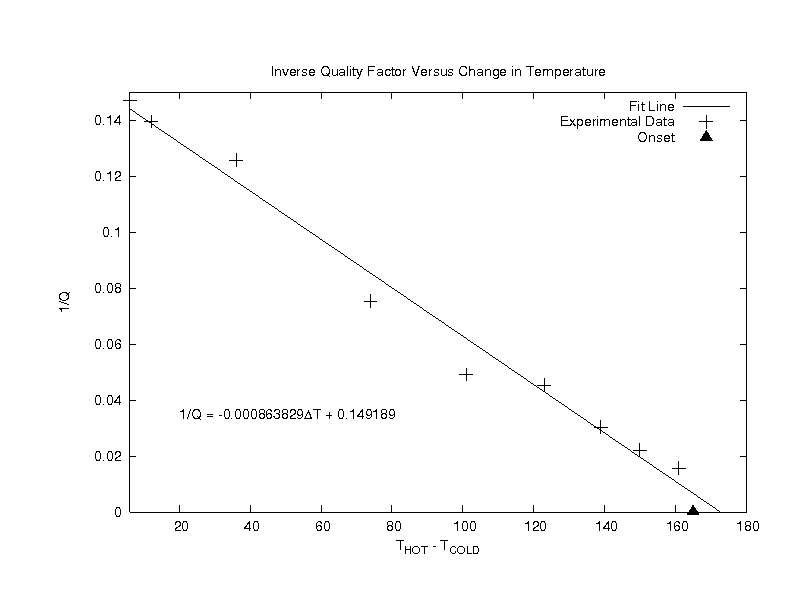
The above graph shows the inverse quality factor as a function of the temperature difference across the stack for several trials.
By linearly fitting these data points, we estimated that the system would begin to self-oscillate at a temperature difference of ~173 oC. Our system actually reached onset at 165 oC, a 4.8% difference from the estimated value. When the system had reached onset, the inverse quality factor had gone to zero, meaning that the quality factor had become infinitely large.
From the equation for the quality factor, this infinitely large value suggests that the net resistance of the system has become
zero. In other words, by increasing the temperature difference across the stack to 165o Celsius, the resistance of the
system has been eliminated. This result is similar to work published by Atchley, et.al. ["Study of a thermoacoustic prime mover below onset of self-oscillation," J. Acoust. Soc. Am. 91. 734-743 (1992).]
Future Investigations
Future research will focus on improving the design of the cold heat exchanger. This research will also include investigating resonance
curves of open-closed pipes as well as the affects of orientation on the system.
Acknowledgements

Arkansas Space Grant Consortium

UCA University Research Counsel
Presentations
This work has been presented at:
The Acoustics Office at Johnson Space Center
Houston, Texas
April 2, 2007
Arkansas Academy of the Sciences
Russellville, Arkansas
April 13, 2007
Arkansas Space Grant Symposium
Morrilton, Arkansas
April 20, 2007
University of Central Arkansas College of Natural Sciences and Mathematics Research Symposium
Conway, Arkansas
April 20, 2007
Holly Smith
August 16, 2007