
| This page gives the 3D models I've created for various purposes such as teaching volumes of revolution in calculus 1. |  |
| Top function: y=sin(x) Bottom Function: x-axis Domain: [0,pi] Rotated Around: x-axis STL Download | 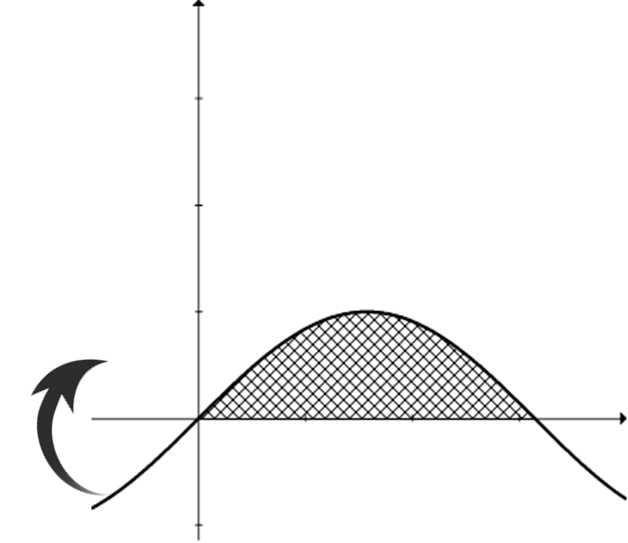 | 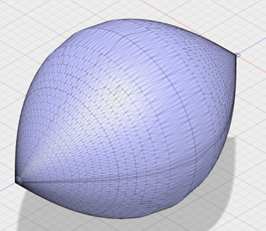 |
| Top function: y=x Bottom Function: y=x^2 Domain: Bounded Region Rotated Around: x-axis STL Download | 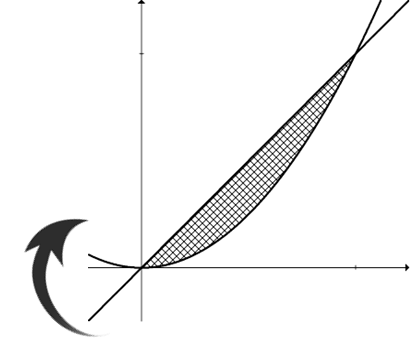 | 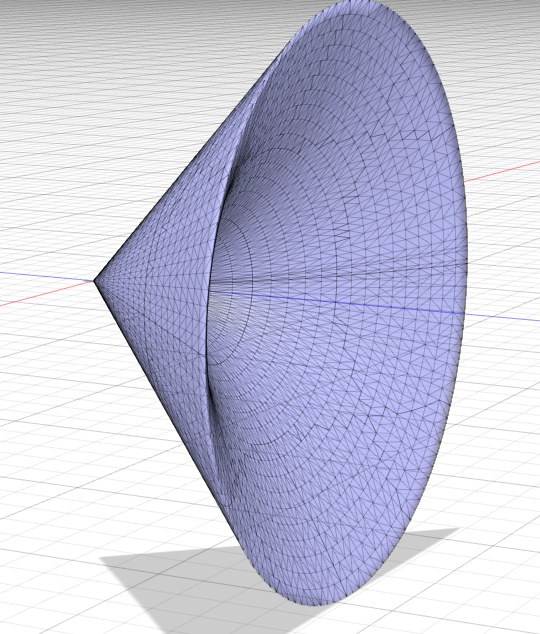 |
| Top function: y=10/x^2 Bottom Function: x-axis Domain: [1,5] Rotated Around: y=10 STL Download | 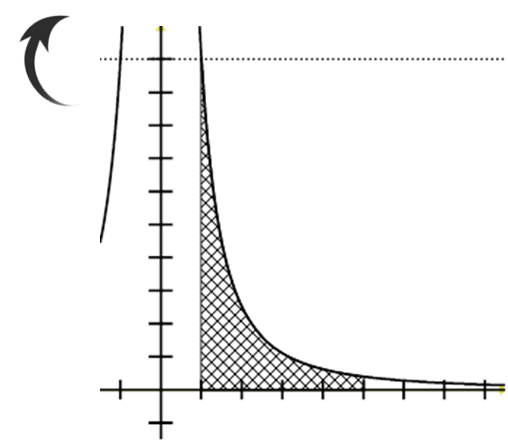 | 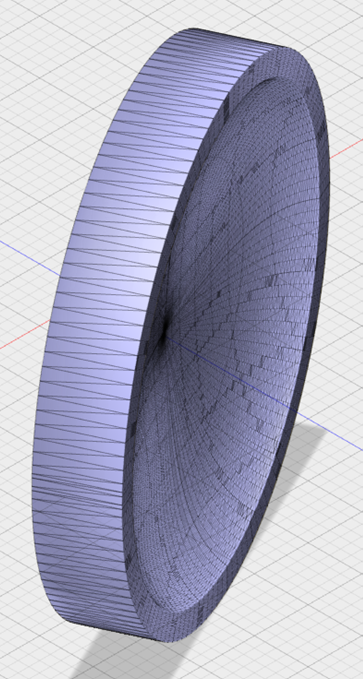 |
| Top function: y=(x+1)^2 Bottom Function: x-axis Domain: [0,2] Rotated Around: x-axis STL Download | 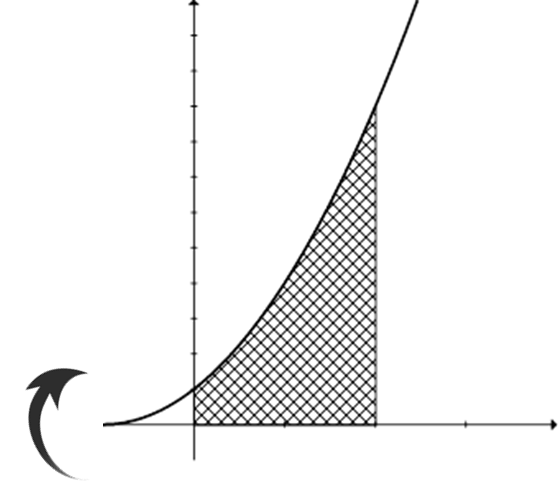 | 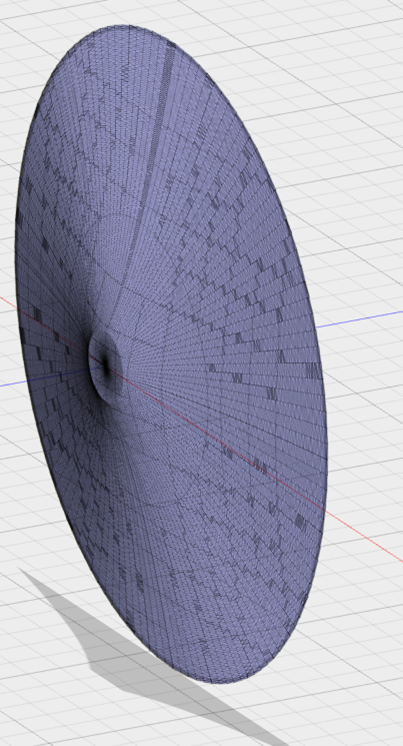 |
| Top function: y=4-x^2 Bottom Function: x-axis Domain: [0,2] Rotated Around: x-axis STL Download | 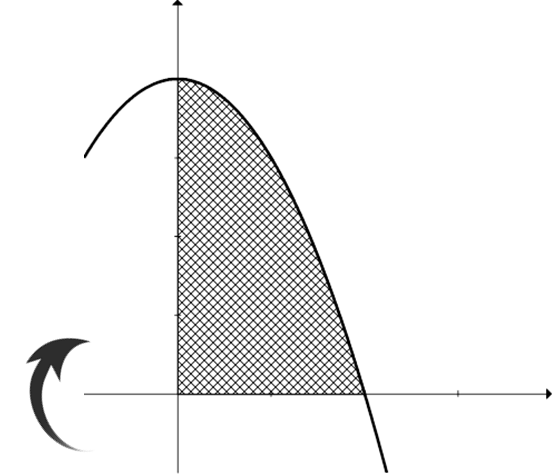 | 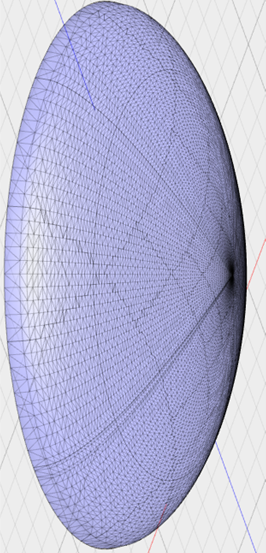 |
| Top function: y=4x^2-4x^3 Bottom Function: x-axis Domain: [0,1] Rotated Around: y-axis STL Download | 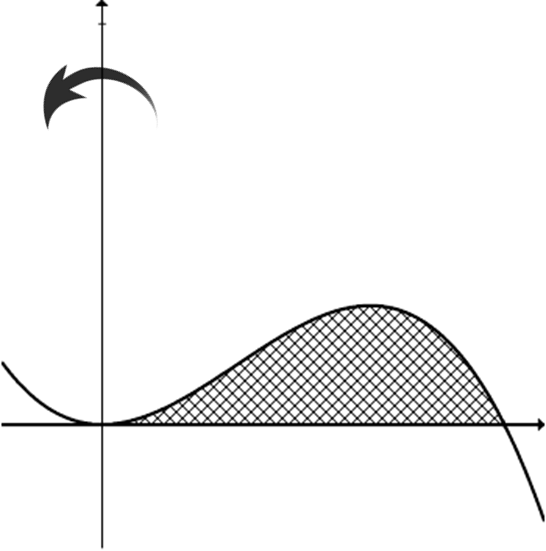 | 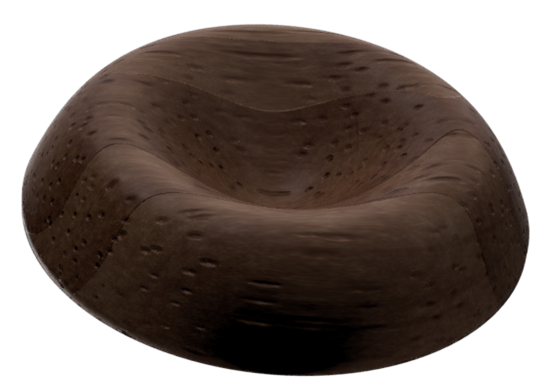 |
| Top function: y=sqrt(x) Bottom Function: x-axis Domain: [0,4] Rotated Around: x-axis STL Download | 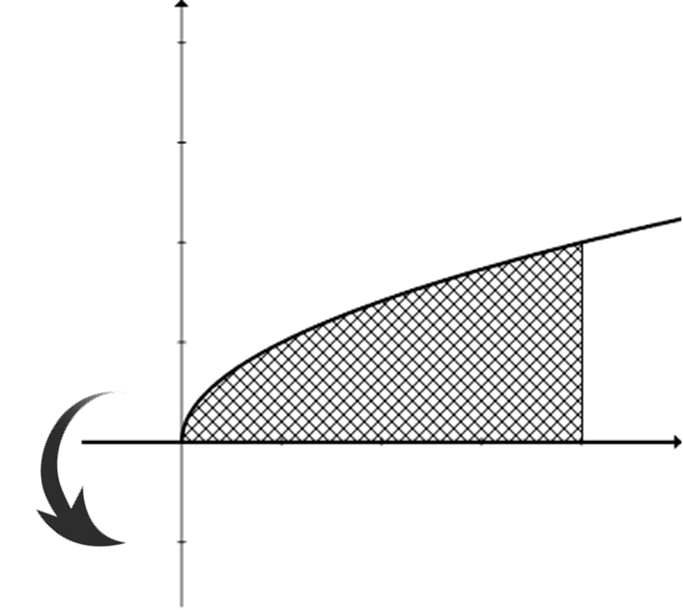 | 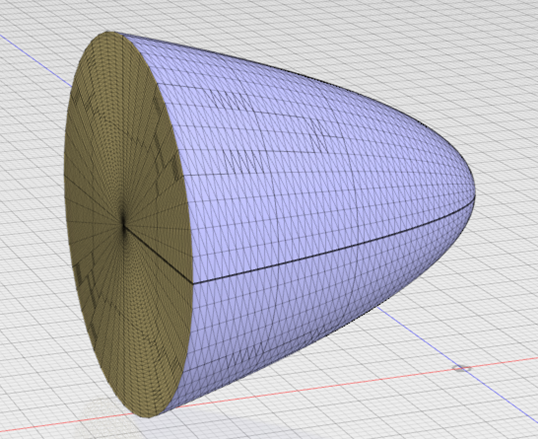 |
| Top function: y=sqrt(x) Bottom Function: x-axis Domain: [0,4] Rotated Around: x-axis STL Download | 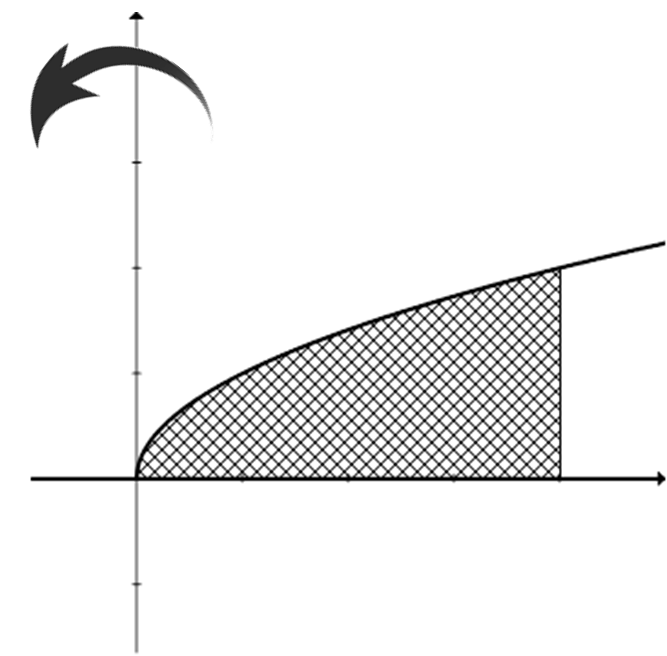 | 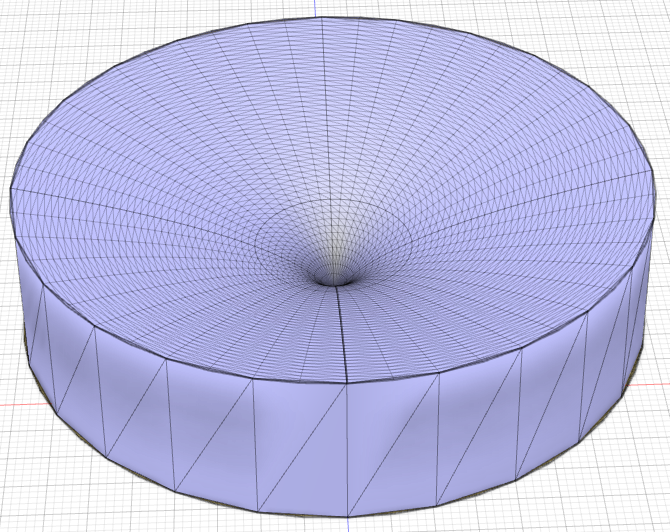 |
| Top function: y=4x-x^2 Bottom Function: y=x^2 Domain: Enclosed Region Rotated Around: x=4 STL Download | 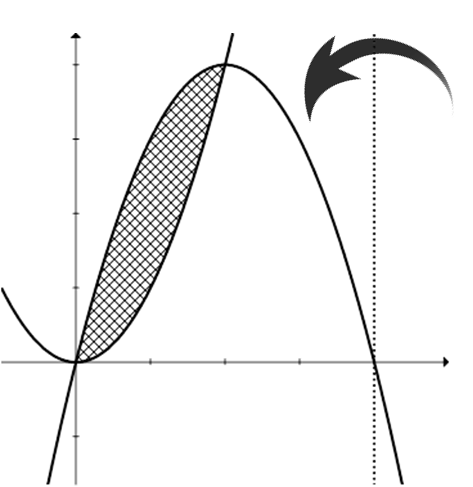 | 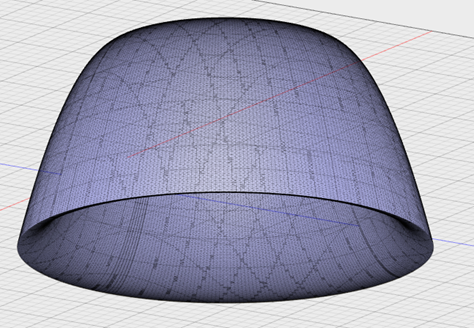 |
| Top function: y=5/x+3 Bottom Function: y=x-1 Domain: [0,?] Rotated Around: x-axis STL Download | 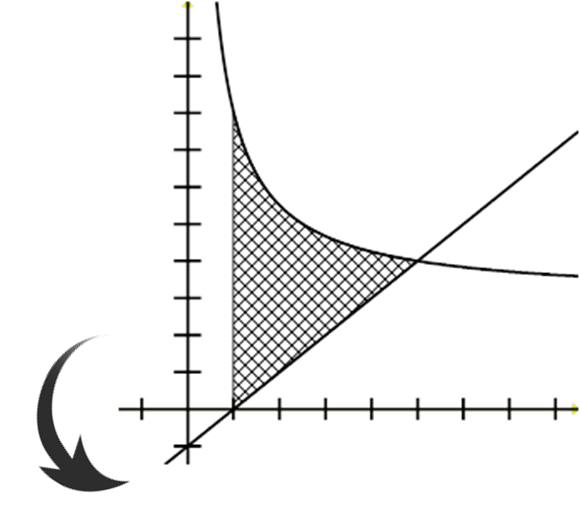 | 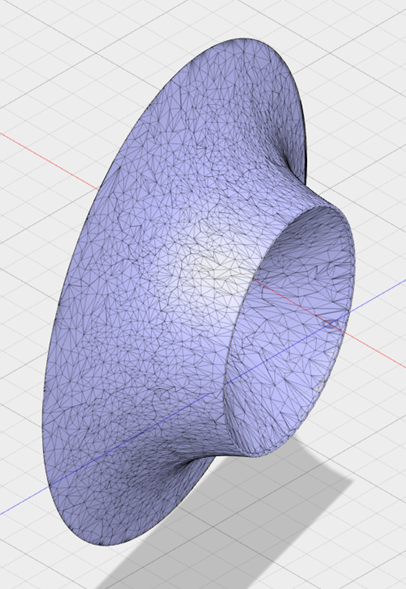 |
| Top function: y=x^3/16 Bottom Function: y=x^2/16 Domain: [1,4] Rotated Around: x-axis STL Download | 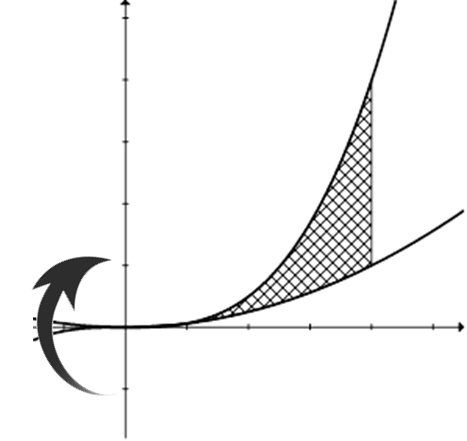 | 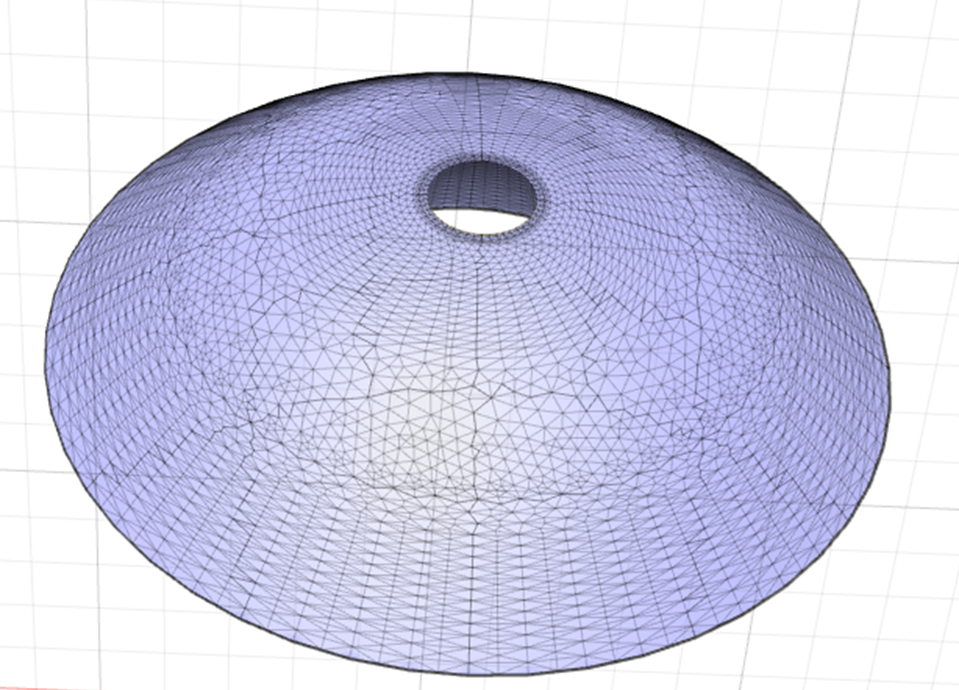 |
| Top function: y=sqrt(x) Bottom Function: y=x^2 Domain: Enclosed Region Rotated Around: x-axis STL Download | 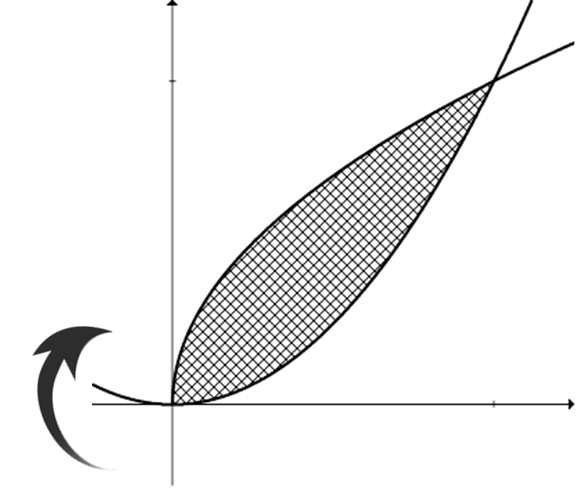 | 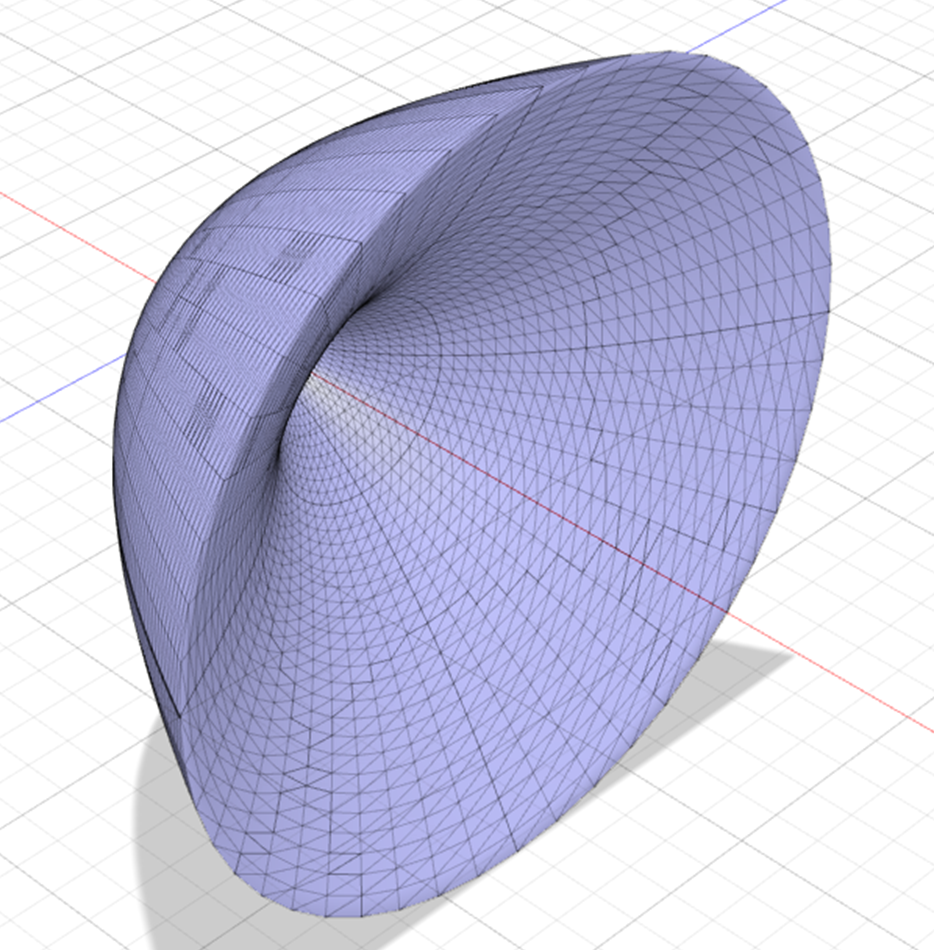 |
A7: Between y=sqrt(x)+1 and the x-axis rotated around the line y=2
(Click the "+" to expand)
| Top function: y=sqrt(x)+1 Bottom Function: x-axis Domain: [0,1] Rotated Around: y=2 STL Download | 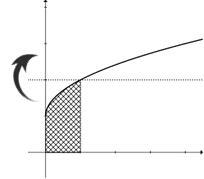 | 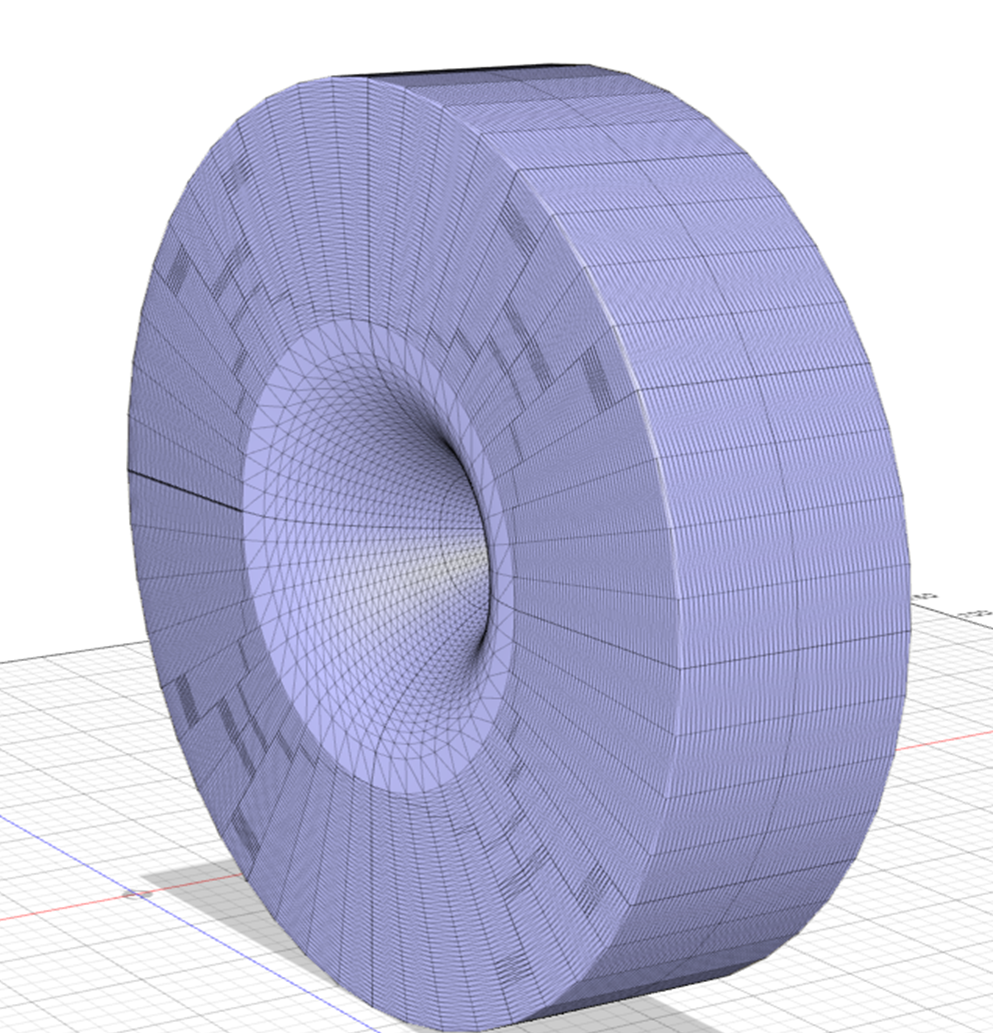 |
| Top function: y=x^3+x+1 Bottom Function: y=1 Domain: [0,1] Rotated Around: x=2 STL Download | 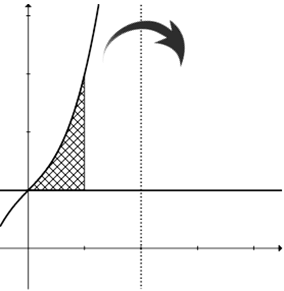 | 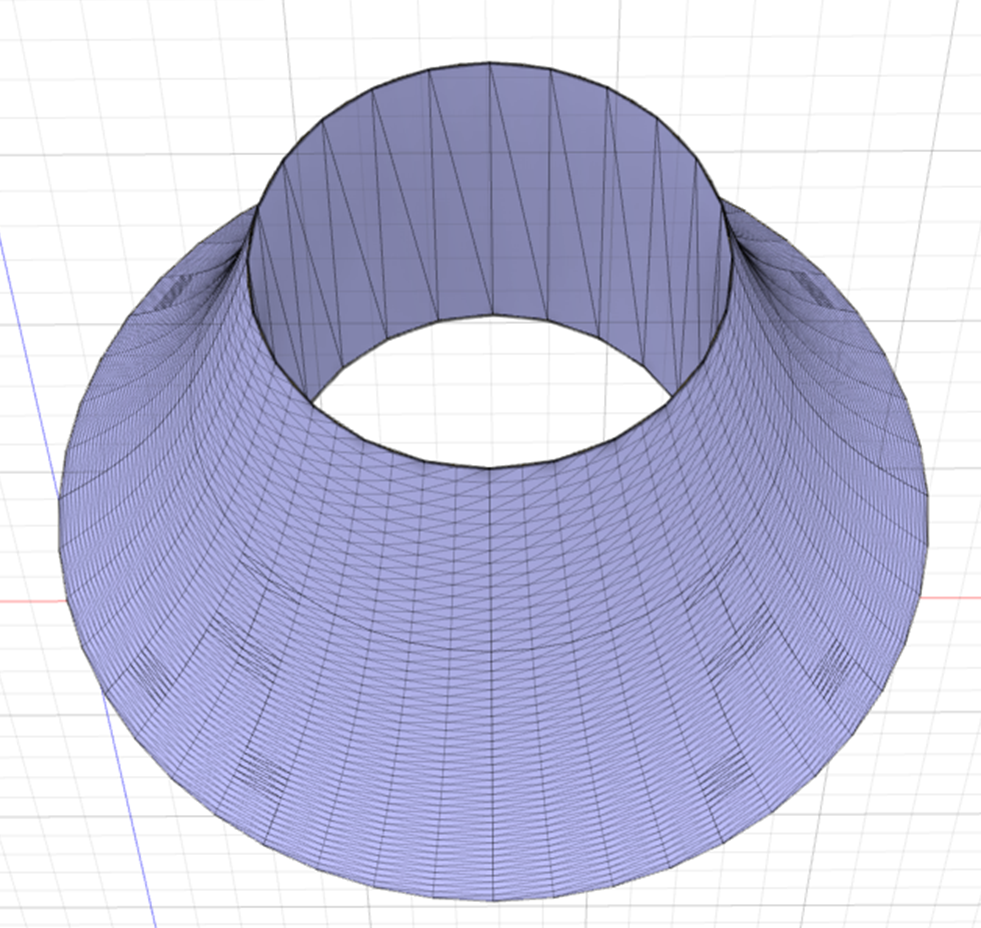 |
| Top function: y=x^3+x+1 Bottom Function: y=0 Domain: [0,1] Rotated Around: x=2 STL Download | 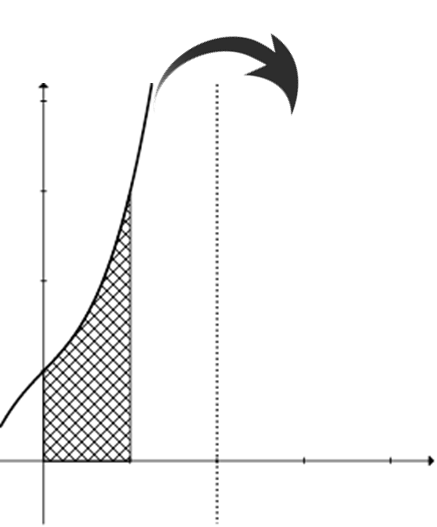 | 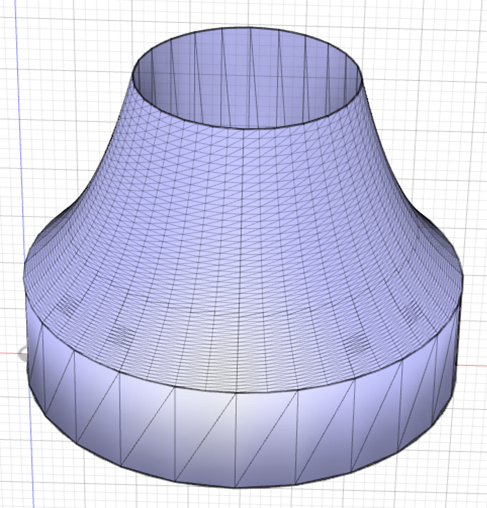 |
| Top function: y=x+1 Bottom Function: x-axis Domain: [0,2] Rotated Around: x-axis STL Download | 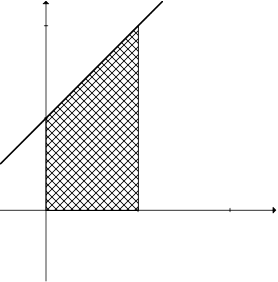 | 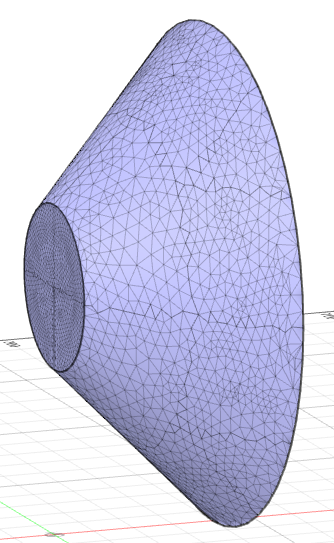 |
| Top function: y=2x Bottom Function: y=x Domain: [0,1] Rotated Around: y-axis STL Download | 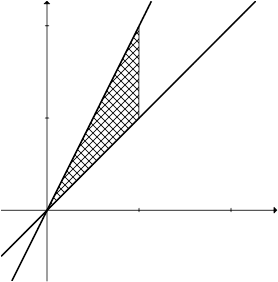 | 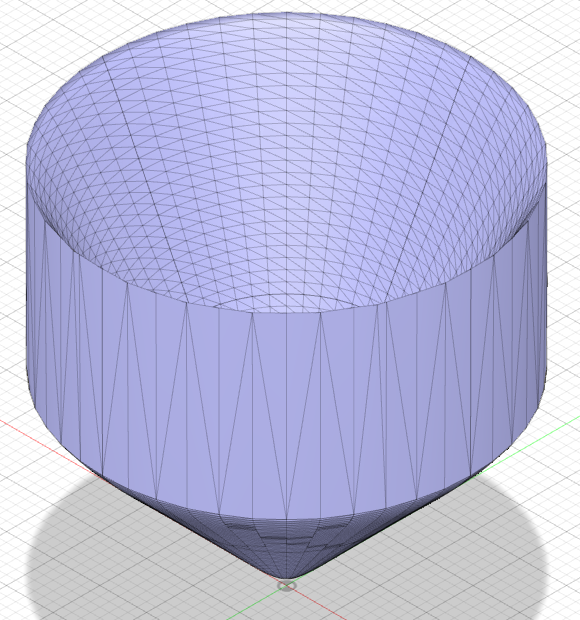 |
| Top function: y=sqrt(x) Bottom Function: x-axis Domain: [0,1] Rotated Around: x-axis STL Download | 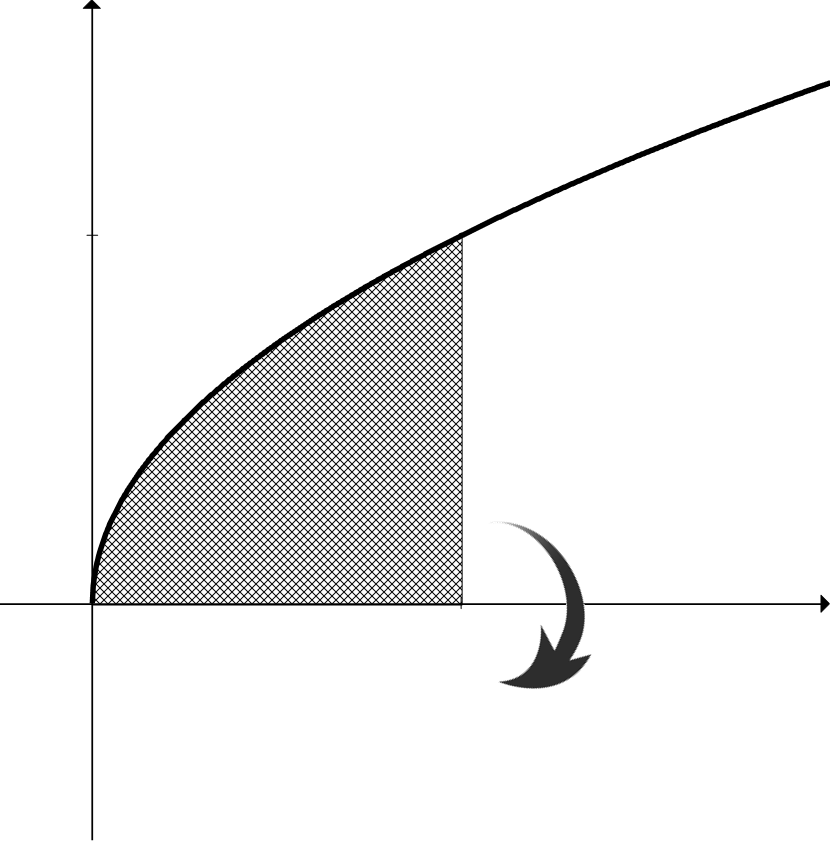 | 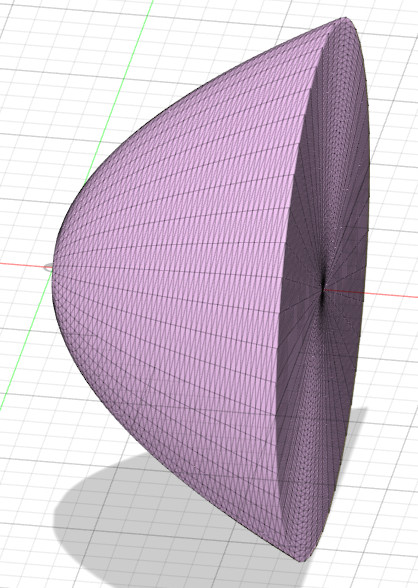 |
| Top function: y=8-2x Bottom Function: y=x^2 Domain: [0,2] Rotated Around: x-axis STL Download | 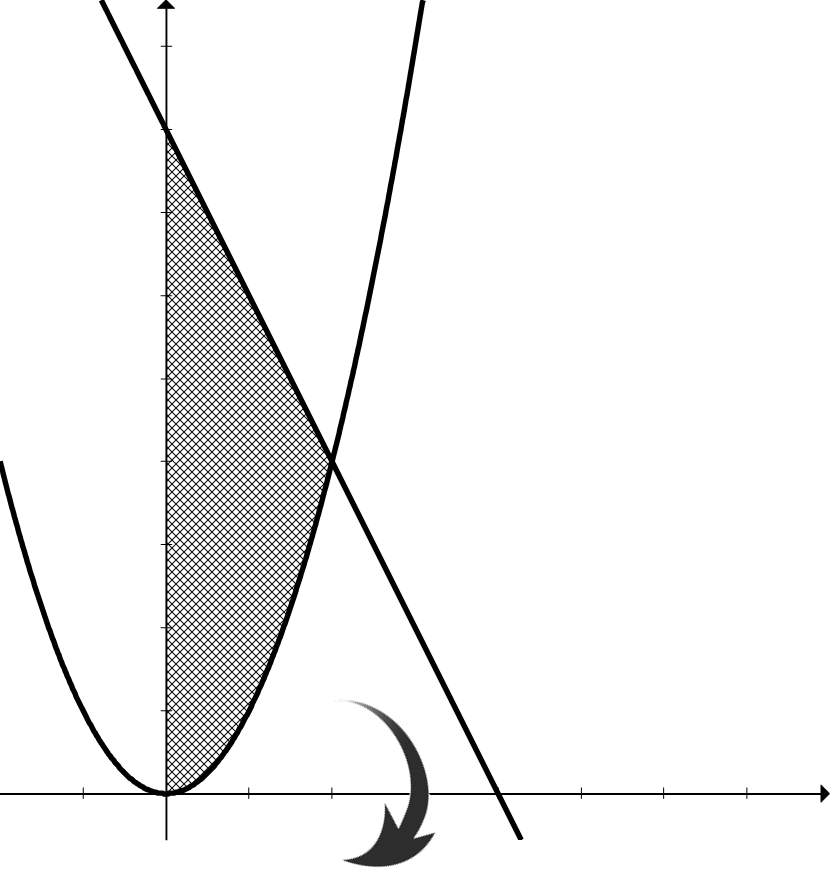 | 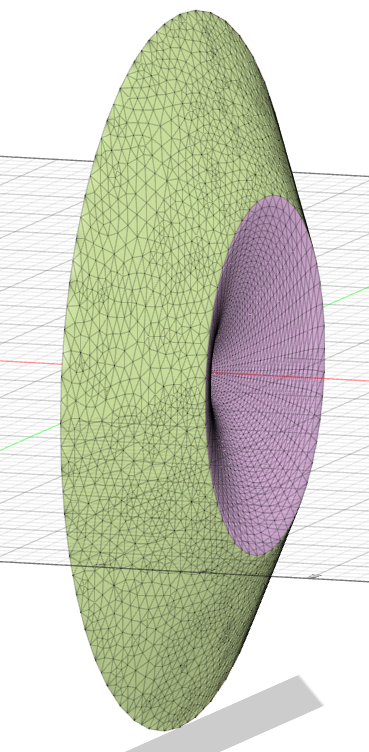 |
D7: Enclosed between x=0, y=0, y=2, and y=sqrt(x-2) rotated around the x-axis
(Click the "+" to expand)
| Top function: y=2 Bottom Function: y=sqrt(x-2) Domain: [0,6] Rotated Around: x-axis STL Download | 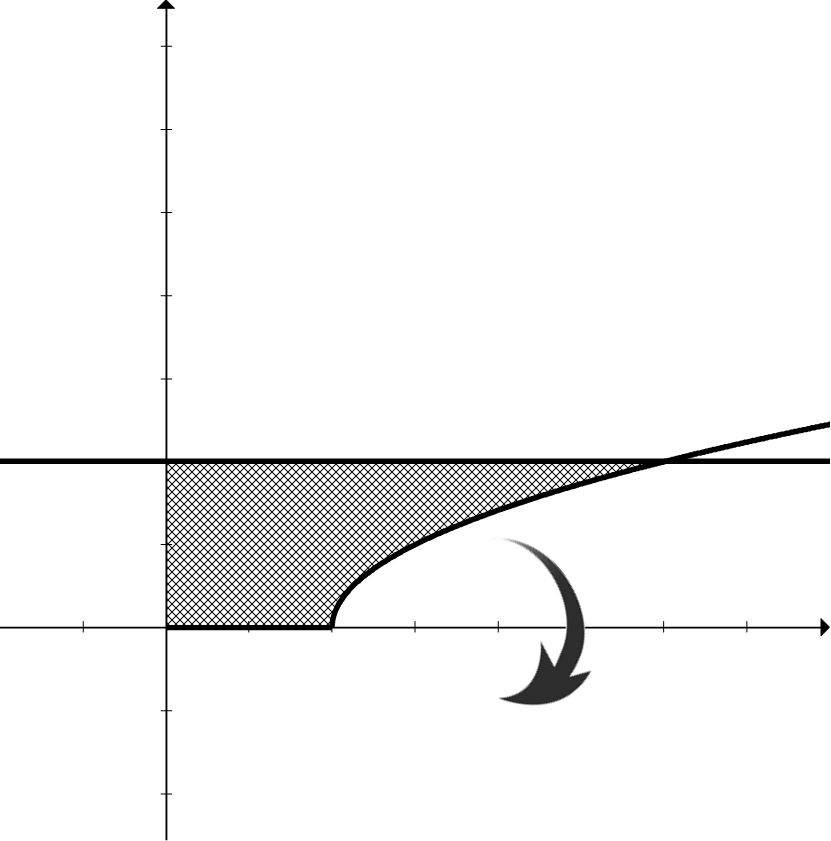 | 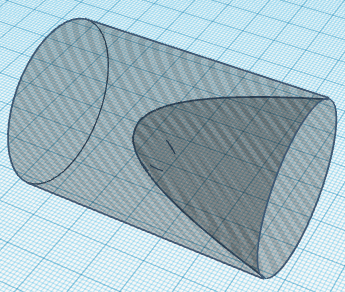 |
| Top function: y=sin(x) Bottom Function: x-axis Domain: [2pi,3pi] Rotated Around: y-axis STL Download |  | 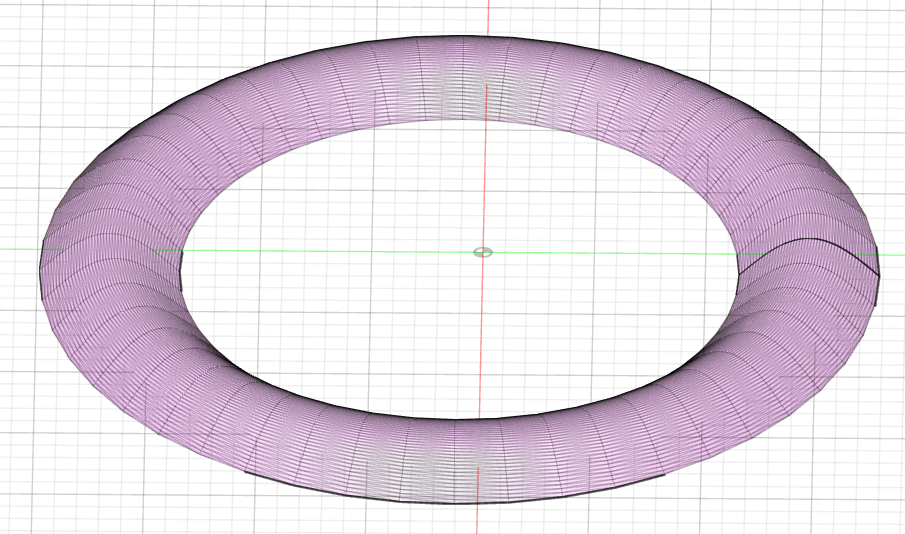 |
| Top function: y=9-x^2 Bottom Function: y=-1 Domain: [1,1.5] Rotated Around: y=-1 STL Download |  | 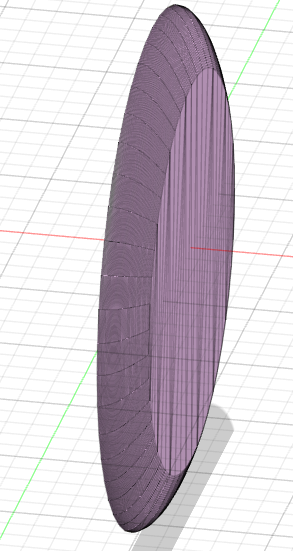 |
| Top function: y=-(x-1)^2+1 Bottom Function: y=0 Domain: [0,2] Rotated Around: y=-1 STL Download | 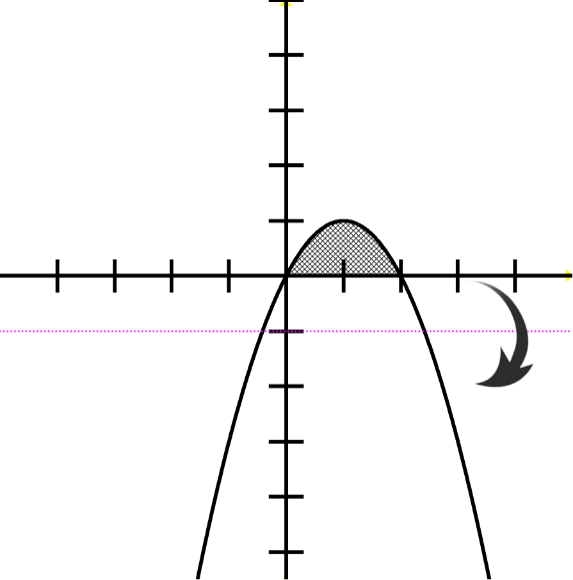 | 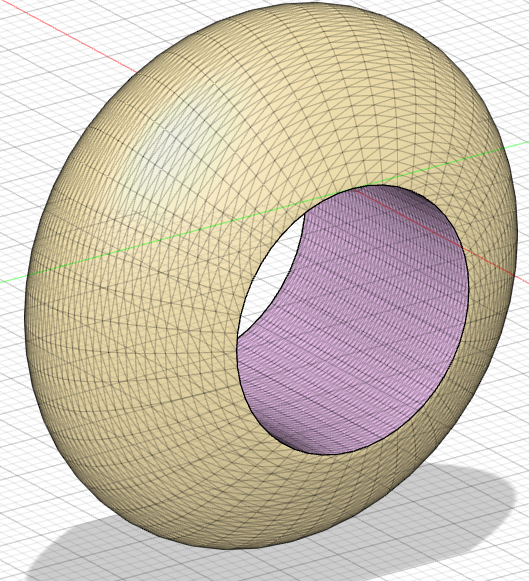 |
| Top function: y=x^3 Bottom Function: y=x^3 Domain: [1,3] Rotated Around: y-axis STL Download | 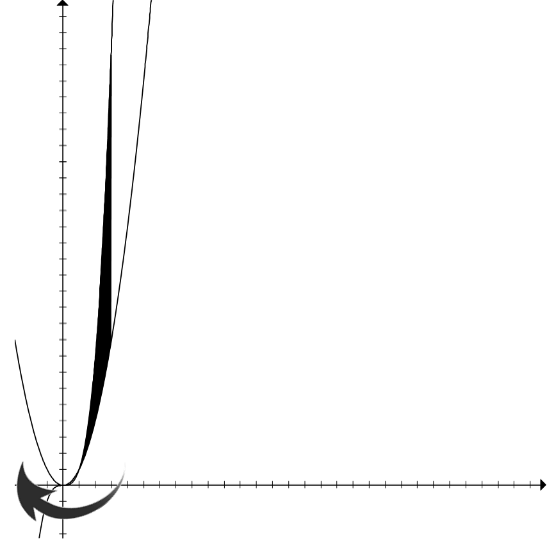 | 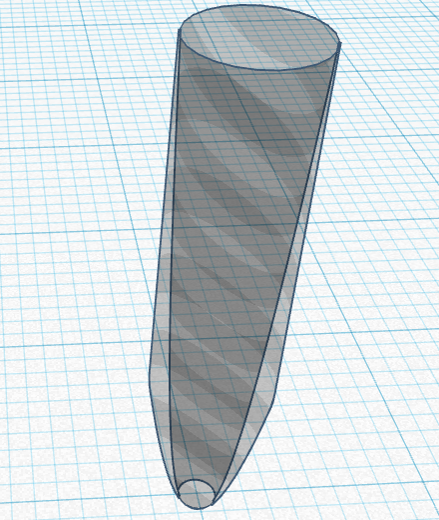 |
| Top function: y=sin(x) Bottom Function: x-axis Domain: [0,pi/2] Rotated Around: x-axis STL Download | 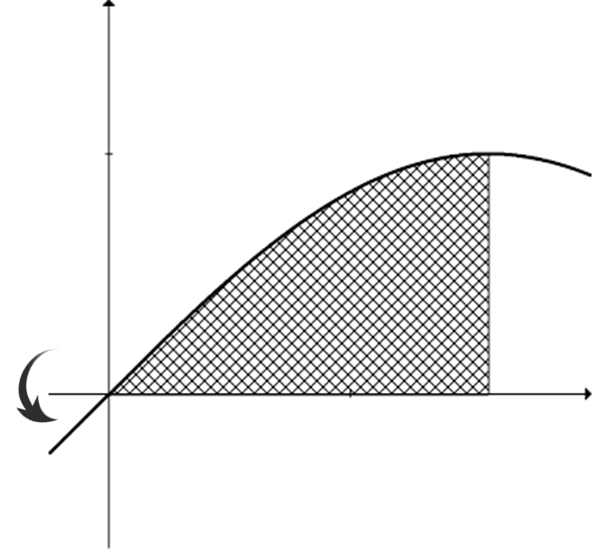 | 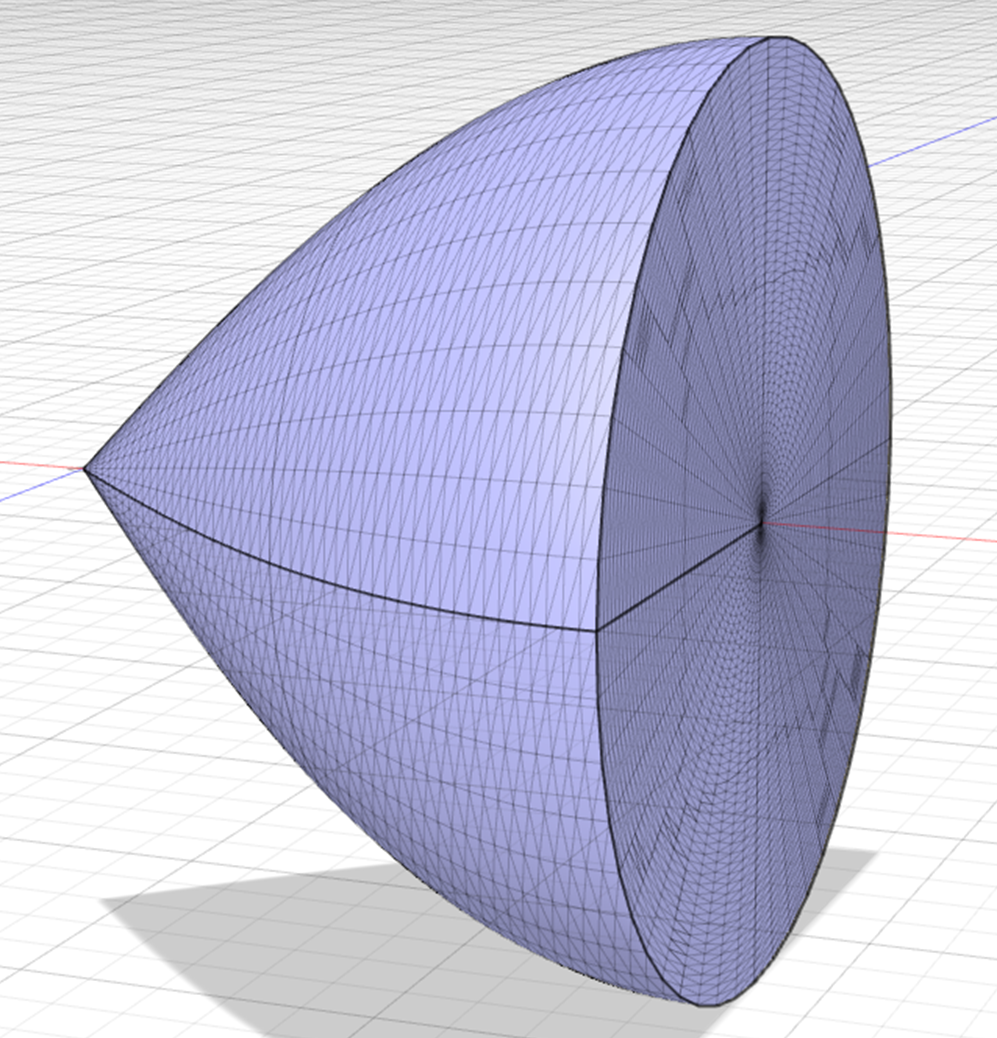 |
| Top function: y=x^2 Bottom Function: x-axis Domain: [0,3] Rotated Around: y-axis STL Download | 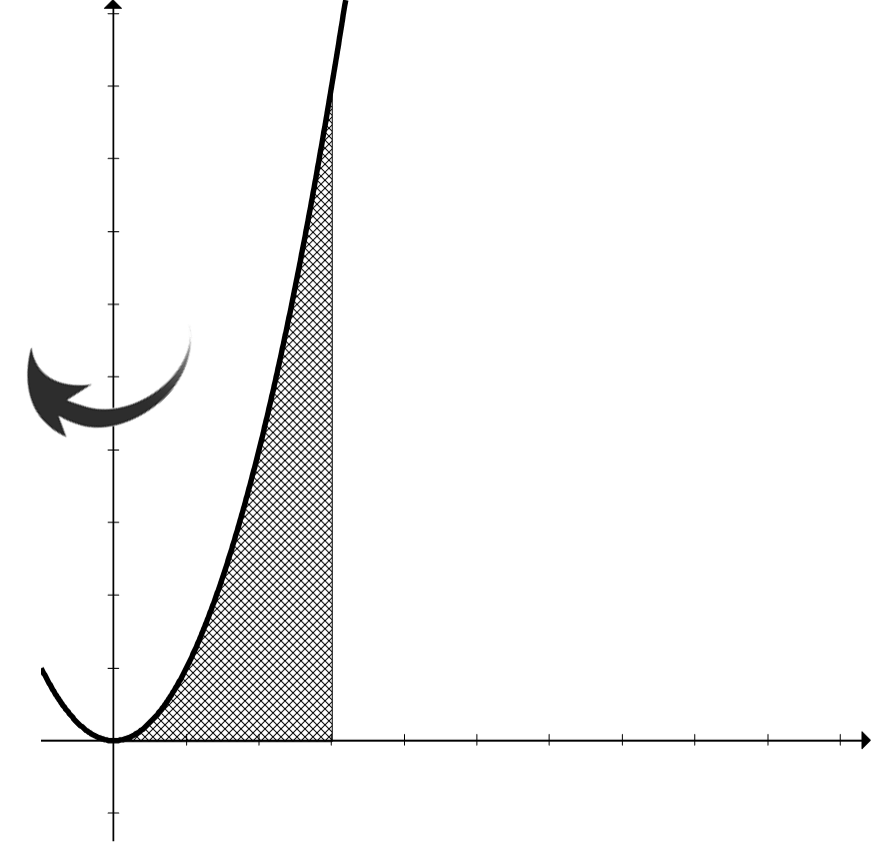 | 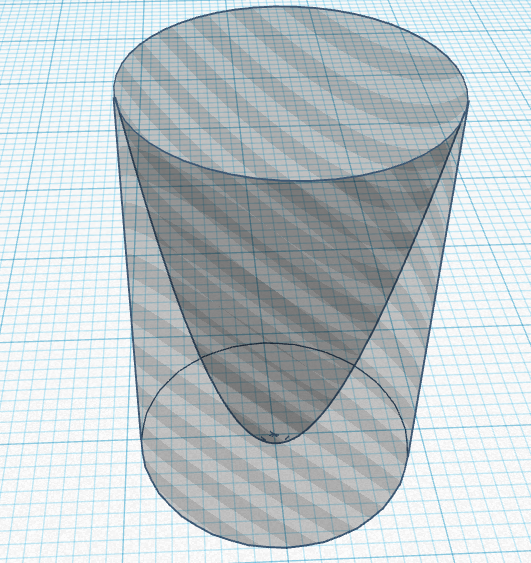 |
Last updated: 03/02/21