Student Objectives
- Become familiar with the decibel scale
- Measure loudness as a function of distance from a point source
- Prepare a graph by hand, scaling the axes appropriately and drawing a best-fit curve
- Examine the graphed data and extrapolate from the observed trend
- Measure your maximum audible frequency and observe how it decreases with age
Procedural Notes
- The Sound Level Meter can be used stand-alone, or plugged into the LabQuest. In this case, it's easiest to use it as a stand-alone device. If you connect the SLM to the LabQuest, it's unwieldy; you have to hold both the meter and the LabQuest, then try to press the data collection button while keeping the meter still--you need three hands. Or, you can just read the SLM display directly and forgo the LabQuest.
- There is no simple way to have the handheld LabQuest generate the dB as a function of distance graph. There are multiple difficult and complicated ways to do it, but none which are really suitable for PHYS 1400.
- I used the LabQuest to collect a data set, but it was annoying, and there was no good way to process it.
- In this case, the easiest thing to do is have students graph by hand. Sure, you could try to have them graph in Excel, but you only have 75 minutes. A log-log plot of the data is nicely linear, but you will reduce them to tears.
- I plotted raw data using LoggerPro, which would be appropriate for PHYS1420, but not for the PHYS 1400. Unbelievably, there is no way to export the .qmbl data file generated by the LabQuest to a .cmbl file readable by LoggerPro. The only export option is to .txt, and the file generated is full of extra
craptext that you would have to delete in order to shape it into something useful for even a spreadsheet to graph. I tried changing the .qmbl file extension to .cmbl just to see if LoggerPro would read the file, but it could not. I ended up typing in the dB values by hand into LoggerPro. Which is why I say: have them graph this by hand, it's just faster. And if you want to make them cry, hand them a sheet of log-log paper to graph on. - The Tone Generator software is very basic, very easy to use, and I got very good results with it. The best results for the dB vs distance came from the "pink noise" setting, which was not irritating to listen to, and which masked most of the background building noise.
- The Tone Generator also lets you play single-frequency tones, and change the frequency. My ears drop out at about 13kHz, but the students should be able to hear through about 18kHz or higher.
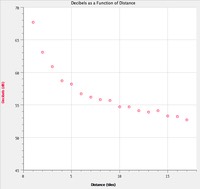
Raw data plotted using Logger Pro; the LabQuest isn't really the best tool for this. Click on graph for full size image.
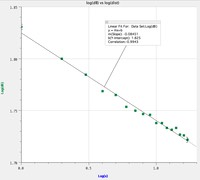
Log-log plot of the above data; the slope is 1/11.7, so not quite 1/12. Click on the graph for a full size image.