Introduction
We have already explored how Kepler was able to use the extensive observations of Tycho Brahe to plot the orbit of Mars and to demonstrate its eccentricity. Tycho, having no telescope, was unable to observe the moons of Jupiter. So, Kepler was not able to actually perform an analysis of the motion of Jupiter's largest moons, and use his own (third) empirical law to deduce Jupiter's mass. As we learned previously, Kepler's Third law states:

where p is the orbital period in Earth years, and a is the semi-major axis of the orbit in AU. Writing Kepler #3 this way is convenient for comparing one planet to another orbiting our sun, but it also applies to any object in orbit around any other object. A more mathematically general statement of Kepler #3 can be written by combining Newton's Second Law and Newton's Law of Gravity:
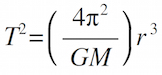
where T is the orbital period in seconds, r is the orbital radius in meters, G is the universal gravitational constant, and M is the mass of the body being orbited. This is a valid relationship for any object in orbit around any other body. To make this general relationship easier to apply, we will do two things:
- replace the constants with their numeric values, and
- perform unit conversions to express T and r in more convenient units.
For the moons of Jupiter, expressing a period in days is an appropriate unit, and expressing the orbital radius as a multiple of Jupiter's diameter also makes sense. If we skip the details of putting the numbers into the equation, the final result looks like this:
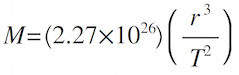
If you measure r in units of Jupiter's diameter (JD) and T in units of days, the resulting mass of Jupiter will be in kilograms.
Objectives
- Use Kepler's Third Law to determine the mass of Jupiter
- Visualize how an apparent motion in 1-dimension actually corresponds to a 2-dimensional movement
- Become familiar with the CLEA/VIREO astronomy simulation software
- Collaborate to combine independent observations into a coherent model
- Compare the accuracy of small and large data sets
Procedure
- Review the manual: Before you come to lab! The Student Lab Manual for this exercise is available online as a .pdf document. You may download it here. A clickable link is also provided on the course web. You probably don't need to print it, but you should spend a little time getting familiar.
- Open the program: We will be using the CLEA exercise "The Revolution of the Moons of Jupiter," and there is a clickable shortcut on the desktop to open the exercise. Remember that you are free to use the computers in LSC 174 at any time.
- Know your moon: Each student will be responsible for making observations of one of Jupiter's four major satellites. You will be assigned to observe one of the following: Io, Europa, Ganymede, or Callisto. When you have completed your set of observations, you must share your results with the class. There will be several sets of observations for each of the observed moons. We will combine the data to calculate an average value.
- Log in: When you are asked to log in, use your name and the computer number on the tag on the top of the computer. This is so your data is saved in a unique location, and you can refer back to it later if necessary.
- Select File → Run: A dialog box will open, and you should set the observation time, date, and observing interval. Set the start date for July 18: 07/18/16. You may leave the default time (0:00 UT). The default observation interval is 24 hours. This is adequate for all of the moon except Io. If you are assigned to observe Io, you must change the interval to 6 hours.
- Observe the motion: Before you begin collecting data, you can take a moment to observe the motion of the satellites. From the File menu, select Preferences → Animation, and you can see the moons in motion. From the Preferences menu you may also select Top View, which will give you another perspective on the motion.
- Collect the data: Turn off the Animation feature before collecting data, and make sure to return to your 07/18/16 start date.
- Record the position: Place the cursor over your moon and left-click. You should see displayed the name of the moon, and its position coordinates. If you do not see the name of the moon, you have not clicked on the moon itself. Record only the x-coordinate, specified in units of JD (Jupiter diameters). You should also record the direction, E or W that is displayed.
- Save your data in two ways: In the program, select Record Measurements, and enter your data for your specific moon. You must enter each observation you make. Save this data (File → Data → Save) frequently. Also record the observation date and position of the moon in a table in your lab notebook.
- Advance to the next observation: Click the Next button, and continue to observe and record your particular moon until you have made 30 observations. This will be July 18 through August 17 for all moons except Io. With a 6hr observation interval, you will observe Io 4 times each day, so you will begin on July 18 at 0:00, and end on July 26 at 12:00.
- Advance through clouds: If you miss an observation due to cloudy weather, you should add an extra interval at the end until you have recorded 30 actual positions for your moon. Clouds should not happen very frequently, but you can expect one or two nights to be obscured.
Data
Your data should consist of the table of observations for your assigned moon. You are not responsible for recording data on other moons which you have not observed. A large data set can be viewed here.
Analysis
The program will perform the initial analysis of the data, and give a result for your moon's period T (in days) and orbital radius r (in JD).
|
|
- Select File → Data → Analyze: Choose the moon you observed from the Select menu.
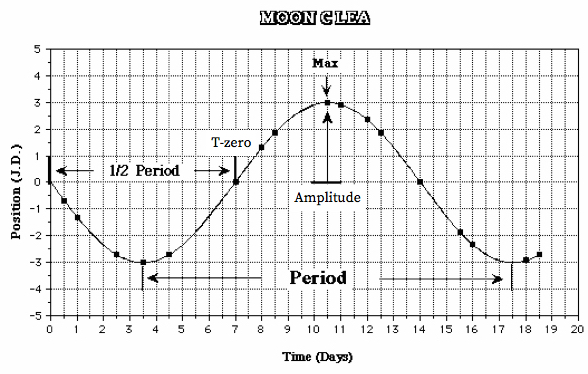
- Select Plot → Plot Type → Connect Points: This will display a jagged, "connect-the-dots" version of your graph. When this graph of data points appears, try to find a pattern by eye, and take note of any data points that seem to be out of place.
- Select Plot → Fit Sine Curve → Set Initial Parameters: You are being asked to provide the program with initial values to use so that it can accurately construct a smooth sine curve to fit your data. Use the graph to find values for T-zero and Period.
- Determine T-zero: Click on a point at which the line connecting the data crosses from negative to positive. (If this happens several times, choose a point toward the left of the screen.) A date and a value very close to zero should appear in the box marked Cursor Value. Enter the date as your T-zero parameter.
- Calculate the Period: Go back to the graph and find the next point at which the line passes from negative to positive (that is, when the moon has completed one full orbit). Subtract the earlier date from the later date and enter this as Period in the dialog box. If the line does not cross from negative to positive twice, use the interval between any two crossings as a good estimate of half the period and then double it. If it is convenient, you can count the number of days of one period directly on the screen, but you will probably have to make an estimate.
- Estimate the Amplitude: Click on the highest or lowest peak of your graph and read the value in the Cursor Position box. The Amplitude is equal to the absolute value of the highest peak or the lowest valley of your graph.
- Click OK: A blue sine curve will appear. It should be a rough fit for all your data points. If not, you may need to repeat the Set Initial Parameters step. If only one or two points are significantly off the blue line, they may represent inaccurate measurements.
- Refine the curve fit: Three scroll bars have appeared: T-Zero, Period, and Amplitude. Adjust each individually until your curve matches your data.
- Adjust the T-Zero point: As you adjust this value, the entire curve will slide to the left or right. Try to achieve the best fit for the data points closest to the T-zero value you selected above. At this stage, pay no attention to the number labeled RMS Residual; just use your eyes. After you've adjusted the T-zero value, you may notice that the points farther away from your T-zero point no longer fit as well.
- Fit the Period: Scroll to stretch or shrink the curve and achieve a better fit. If at any time you cannot scroll far enough to get a good fit, select Plot → Reset Scrollbars → Normal Sensitivity to re-center the bars.
- Adjust the Amplitude: Fit the points near the peaks and valleys. You may wish to return to the other scroll bars for further adjustment, but the goal at this point is a good, though not necessarily perfect, fit.
- Fine tune the curve fit: Return to adjusting the T-zero scroll bar, this time observing the RMS Residual. The smaller the value of this number is (note that it is expressed in scientific notation), the better the fit. Continue this process with the Period and Amplitude bars. Repeat the scroll bar adjustments until all three yield the lowest RMS Residual.
- Record your results: When your curve fit is sufficiently accurate, record the values for the period (T in days) and amplitude (r in JD). Post your values on the board to share with the class.
Questions
- Calculate the mass: Use the equation below and your own individual data to calculate the mass of Jupiter in kilograms (kg).
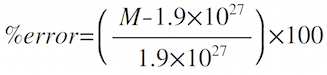
- Determine your accuracy: For your individual data, calculate the % error in your result for Jupiter's mass. The accepted value for the mass of Jupiter is 1.9x1027kg:
- Summarize the class results: Construct a table for the mass and % error, calculated from the class data.
Moon |
Average Mass of Jupiter (kg) |
% Error |
Io |
|
|
Europa |
|
|
Ganymede |
|
|
Callisto |
|
|
Overall Average |
|
|
- One or many? Is the overall average of combining many sets of observations better than an average obtained from a single set of data? Why might this be?
- Bad moon? Does the data from one moon appear less accurate than the others? Why might this be?
- Better data? What could you do differently to get better data? Suggest specifically how, using this method, you might improve the accuracy of your calculated mass.
- Themisto? Predict the orbital period in days of Jupiter's moon Themisto, which has an orbital radius r = 52 JD. Calculate using the accepted value for the mass of Jupiter, 1.9x1027kg.
|