Introduction
Professional astronomy can be surprisingly competitive. There are not many large telescopes, and telescope time is limited by daylight and cloudy conditions. When an astronomer applies for observing time, he is not guaranteed that it will be granted−there are a large number of astronomers applying for a small amount of time. And even if telescope time is awarded, that's no guarantee of observing time: weather conditions may prevent observations, and once your time is up, it's up and the next guy in line gets his turn!
Lucky for us, we can simulate the observing experience with astonishing realism. We will not be able to get observing time on a real telescope, but the VIREO (The VIRtual Education Observatory) program we will use has been designed by astrophysicists to reproduce an accurate observing experience. Click to download the Student Manual for this exercise.
The advantage of this manual is that is provides additional detail describing the program features, but you may not need to print the entire document. A clickable link is provided on the course web, and remember that you can run these programs any time the lab LSC 174 is open.
Objectives
The Pleiades are a cluster of stars that not only appear close together to us here on Earth, but are actually located close to each other in space. Our goal is to determine how far this cluster is, relative to the Earth.
You have been granted unlimited observing time on a 0.4 meter optical telescope and permission to request time on a 1.0 meter and/or 4.0 meter optical telescopes. The telescopes will be equipped with filter wheels and photoelectric photometers. Your project mission is to
- Obtain multi-color (B (for short-λ blue) and V (for visible, peak λ in the green)) photometry of a sample of 24 stars in the Pleiades star cluster
- Compare the main sequence of the cluster to a calibrated absolute magnitude main sequence
- Graphically determine the distance to this cluster
Procedures
This lab will take two sessions to complete. You should spend the first lab period using the computer to collect observational data. If you need additional time, you may use the computer lab the following day when it is not reserved for another class.
We will spend the second lab period performing the analysis of the photometric data. We will meet in the lab classroom, and you must be prepared with your complete set of observational data.
Monday: Observation and Data Collection
- Start VIREO: Double click on the icon for the VIREO program found on the desktop.
- File → Login: Enter your name and the number of the computer and click OK.
- File → Run Exercise → Photoelectric Photometry of the Pleiades.
- Telescopes → Access 0.4 Meter: Choose a telescope, or Request Time→ on either the 1.0 Meter or 4.0 Meter. If you are granted time on either of the larger telescopes, then you will have to access them from the menu in order to use them. (Hint: Bigger telescope means more light-gathering power means shorter exposures required!)
- Control the scope: Once you have selected of one of the telescopes you will need to open the dome, and once the dome is open you will need to turn on the Telescope Control Panel.
- Tracking: Turn on the telescope Tracking on from the control panel.
- Field of view: Toggle from Finder view to Telescope view. This switch occasionally sticks, and you might have to toggle a second time to change to the Telescope view.
Sky Calibration
The sky is never perfectly dark. You will need to teach the instrument computer what the sky brightness level is for your observing session by observing blank region of sky.
- Clear the field of view: Make sure there are no objects in the circular aperture of the photometer. If there are, use the N-S-E-W buttons to move the telescope aperture to a part of the sky free from any apparent objects.
- Access the Photometer Control Panel.
- Calibrate the B: Set Filter → B, Reading → Sky, Integration Seconds → 10, and # of Integrations → 3. Click Start to take a sky reading with the B filter.
- Calibrate the V: Repeat the step above but with the Filter → V.
- Re-calibrate: If at any time you switch to a different telescope, you must calibrate the sky for that telescope (because it is a different size and has different light gathering power).
Targeting Stars
- Slew → Observation Hot List → Object View/Select from List: Double click on the star you want to observe. Click OK to slew the telescope to those coordinates. Once the telescope has completed its slew, there should be a star centered in the aperture.
B and V Photometry
- Set exposure time: Total exposure time is Integration Seconds multiplied by the # of Integrations. You cannot set the exposure time to any arbitrary value, but you should be able to find a combination to get you close the the exposure time you may desire.
- Watch your S/N: A bigger number is better (more signal, less noise), and we want values of at least S/N = 100. Very bright objects will reach this level with shorter total exposure times, but dimmer objects are going to require either an increased number of Integration Seconds, or more # of Integrations.
- Reading → Object: Make absolutely certain that you do not miss this step! If you leave your setting on Sky, you are not collecting data properly, and you will have to recalibrate your sky a second time.
- Select a filter: Choose B or V. You will want both B and V magnitudes for each star from the Hot List. You will perform an exposure for each star using each filter.
- Start: Once you have the exposure time and filter set, start the exposure (Integration) by clicking on the Start button.
- File → Data → Record/Review: Once the exposure is complete, the sky-subtracted magnitude and S/N ratio will be displayed. Record in your note book the stellar magnitude and also save the results on the computer.
|
|
- Complete your data table: Obtain a B magnitude and V magnitude for each star in the Hot List. Write down the values in your notebook as well as saving them on the computer.
Star
B
V
B − V
| | | |
| N2230-01442 |
10.508 |
8.797 |
1.711 |
| etc... |
|
|
|
Notice as you collect and record data that the brighter a star appears, the lower its B or V brightness number is! A dim star has a high B or V magnitude, a bright star has a low or even a negative value.
Wednesday: Data Reduction and Analysis
- You must have a complete data set to proceed. Please do not skip the Week 1 data collection and then expect someone else in lab to hand over their painstakingly collected data for you to use.
- Compute: Calculate the B−V color index for each of the stars by taking the B-magnitude and subtracting the V-magnitude from it.
- Graph: Using most of a lab notebook page, create a graph like the one shown below. The larger you make your graph, the more accurate your results will be.
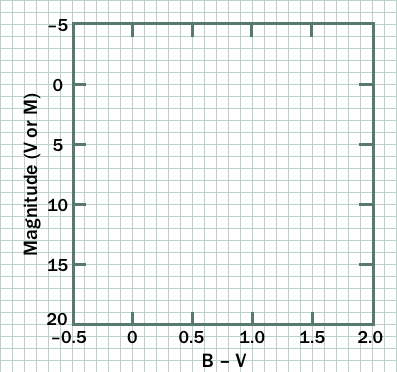
- Plot your data: For each of the 24 stars, plot B−V on the x-axis and V on the y-axis. Do not label each star but use the same plot symbol (or color) for each of the Pleiades stars.
- Plot the reference stars: On the same graph, plot a calibrated set of main sequence stars. From the table below, plot B−V for the x-coordinate and M (absolute magnitude) for the y-coordinate using a different plot symbol (or color) than the one used for the Pleiades.
Absolute Magnitudes of Main-Sequence Stars |
B−V |
M
(Absolute Magnitude) |
B−V |
M
(Absolute Magnitude) |
| -0.31 |
-4.1 |
0.7 |
5.1 |
| -0.16 |
-1.1 |
0.89 |
5.9 |
| 0 |
0.4 |
1.18 |
7.3 |
| 0.13 |
2 |
1.45 |
9 |
| 0.27 |
2.6 |
1.63 |
11.8 |
| 0.42 |
3.4 |
1.81 |
16 |
| 0.58 |
4.4 |
- Fit both curves: Draw a smooth curve though the main-sequence for the Pleiades and for the calibrated stars. Your graph should look similar to the one below.
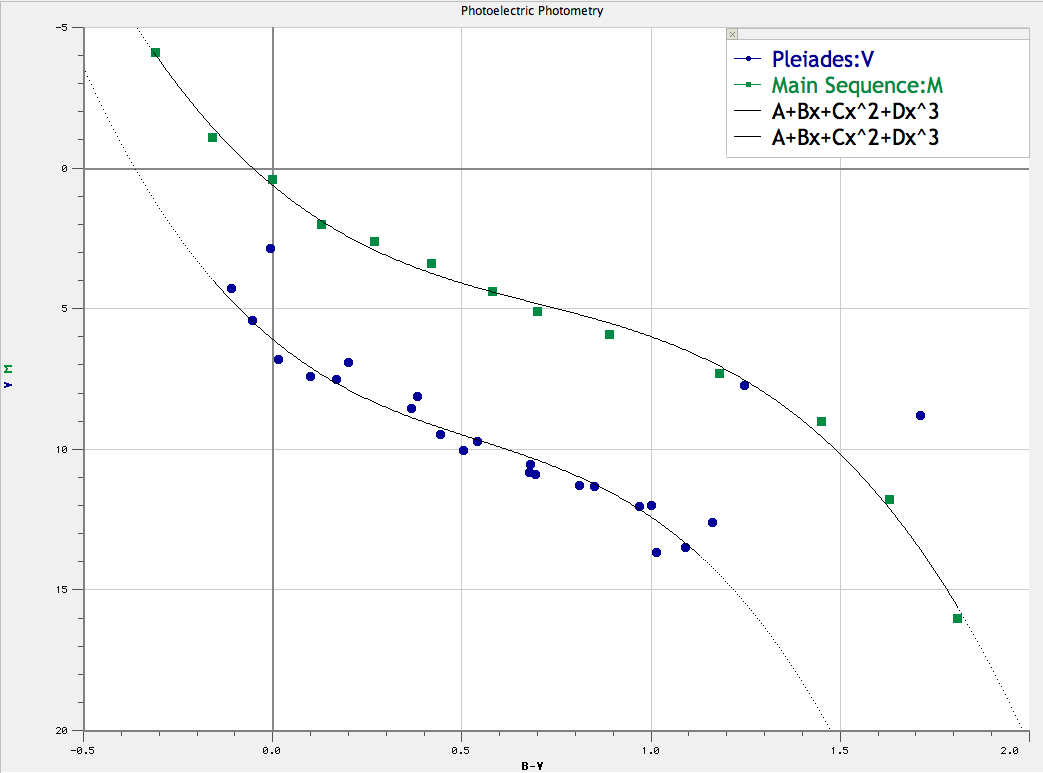
- Skip the outliers: If there are any Pleiades stars that are not main-sequence stars, indicate them and do not draw your curve through them.
- Compare the curves: Is your Pleiades curve brighter or dimmer than the 10 pc curve? The calibrated main-sequence represents the magnitudes that a cluster of main-sequence stars would have if they were 10 pc from the Earth. Keeping that in mind, are the Pleiades further or closer than 10 pc?
- Find (V−M): To determine how many parsecs (pc) the Pleiades cluster is from us, you need to measure how many magnitudes separate the Pleiades main-sequence and the standard main-sequence (V-M). We will discuss exactly how to do this during the second lab session.
- Calculate: Use the equation below to find the distance to the Pleiades in parsecs.
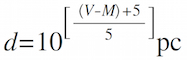
Note that this reads "ten raised to the power of" and not "ten multiplied by"
- Compare: If the accepted value for the distance to the Pleiades is 135 pc, what is your percent error?
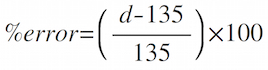
- Convert: What is the distance in light years given 1 pc=3.26 ly?
|