Introduction
Why do neon lights glow? That, and why do they glow in different colors? First the glow: a neon tube is sealed and contains atoms of gas (neon, or maybe something else−more on that in a minute). When a voltage is applied, the tube begins to glow: flip the switch, the light comes on. The gas is energized by the voltage: all the neon atoms are the same, which means that the electrons of all the atoms exist in orbits with the same energy levels. Whatever precise amount of energy it takes to move an electron from one orbit to another, it's the same for all the neon atoms. So what you are seeing as the glow is electrons jumping from one energy level to another. As they fall back down to their original orbits, they emit an exact amount of energy in the form of a photon. When the millions of atoms in the tube all do this at the same time, all those emitted photons create the glow.
Now about the color. We know that the orbits correspond to precise energy quanta. But the quantum of energy is different for electrons belonging to different types of atoms. It does not take the same amount of energy to move an electron from one orbit to another in a hydrogen atom as it does to move between orbits in a neon atom. Different energy, different color. Neon glows strongly red, but mercury glows strongly blue. So it's not always actual neon in the neon light; it may be argon (with mercury particles), helium (yellow-gold) or even CO2 (bright white).
Objectives
- View emission−line spectra of various elements
- Identify elements based on the pattern of emission lines
- Associate wavelengths of visible light with color
- Correlate the color of emitted light to the temperature of an object
- Determine the radial velocity of an astronomical object by observing the Doppler shift in its emission spectrum lines
- Experimental
Equipment
- Handheld spectroscope
- Gas−filled lamps
Procedure
- Point the slit of the spectroscope directly at the gas−filled lamp.
- View the emission lines that appear, and record the color and wavelength for each line.
- Note the color−code identification on the lamp.
- Identify the gas in the lamp by comparing the observed lines to the standard spectra provided.
- Repeat for the remaining lamps.
Data
Make a table of the lamps you have viewed, and use it to identify the vapor in each lamp. You will need more rows for more lamps, and more columns for more observed emission lines than the example table shown below.
Tube Number |
Emission Line Wavelength (top) and Color (bottom) |
Vapor ID |
Example |
460 |
496 |
609 |
670 |
|
|
|
|
lithium |
| blue |
blue |
yellow |
red |
|
|
|
|
1 |
|
|
|
|
|
|
|
|
|
| |
|
|
|
|
|
|
|
2 |
|
|
|
|
|
|
|
|
|
| |
|
|
|
|
|
|
|
etc. |
|
|
|
|
|
|
|
|
|
| |
|
|
|
|
|
|
|
Use the reference table shown below and the wall chart to complete your identification of the lamps:
Element |
Strongest Emission Lines: Wavelengths in nm |
| hydrogen |
410 |
434 |
486 |
656 |
| helium |
447 |
471 |
492 |
502 |
588 |
668 |
707 |
| neon |
540 |
585 |
587 |
588 |
594 |
597 |
598 |
599 |
603 |
607 |
610 |
640 |
651 |
| mercury |
405 |
435 |
513 |
546 |
577 |
579 |
615 |
| argon |
416 |
420 |
428 |
435 |
466 |
473 |
476 |
481 |
488 |
642 |
697 |
707 |
715 |
| krypton |
427 |
432 |
436 |
438 |
447 |
458 |
462 |
463 |
466 |
474 |
477 |
557 |
587 |
| sodium |
570 |
589 |
615 |
|
|
Questions
- Label the lines: The emission spectrum for cadmium (Cd) is shown below in color. Using the table that correlates the color of the emission line with wavelength and the wall chart, label each emission line with an approximate wavelength.

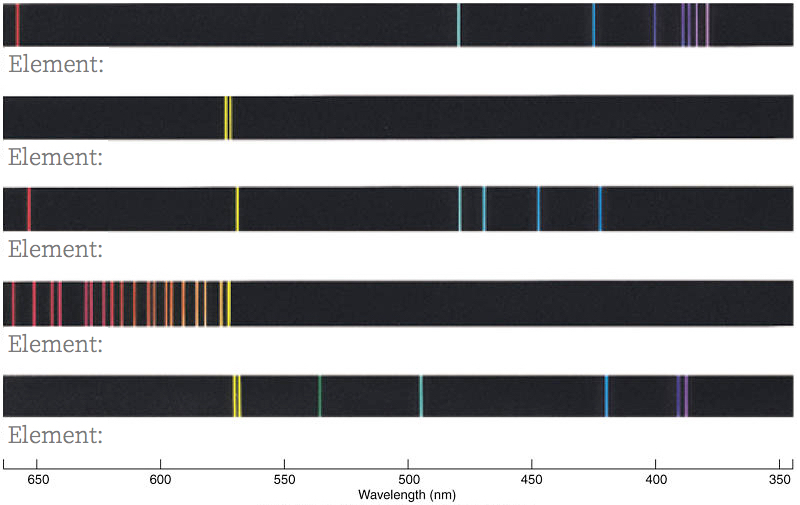
- Recognize the patterns: Below and in color are the emission spectra for five of the gases in the tubes you have examined. Because line strengths vary (and this is not shown on the figure), you may not have seen every line shown. Identify each of the shown spectra with the correct element.
- Find the temperature: The temperature (in Kelvins) of an object can be determined by noting the wavelength of its strongest emission (brightest color):
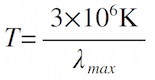
with λmax measured in nm. Find the temperature of a
- red star: λmax = 650nm.
- blue star: λmax = 425nm.
- block of ice: λmax = 104 nm.
- Find the speed: The radial velocity of a star can be determined from the Doppler shift of the lines of its spectrum. This is given by:
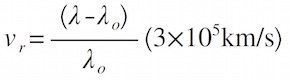
where λo is the unshifted wavelength, when the velocity of an object is zero. The observed wavelength λ is the shifted wavelength of the object in motion. Find the radial velocity of
- a star observed to have an H-alpha line (λo = 656.30nm) at a wavelength λ = 656.52nm.
- a galaxy observed to have a calcium K-line (λo = 393.40nm) at a wavelength λ = 445.85nm.
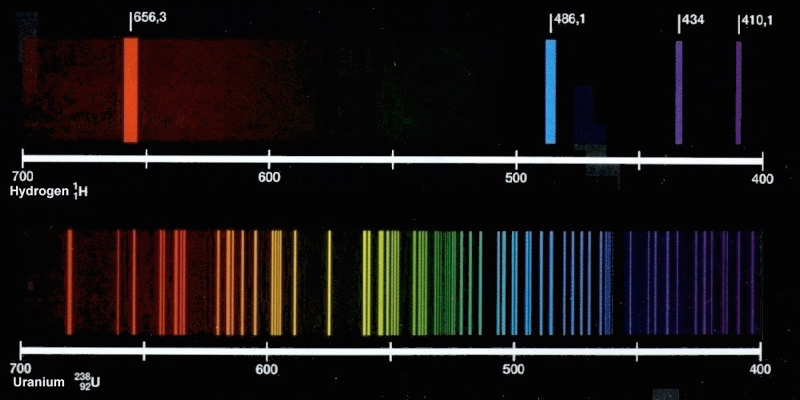
- Compare the elements: The figure above shows the emission spectra for helium and uranium. A neutral helium atom has just two electrons, while a neutral uranium atom has 92. Briefly explain why the emission spectrum for uranium has so many more lines than the helium spectrum.
|