Introduction
As we have seen, observing the individual stars in a cluster can give us information about the cluster as a whole. We will continue our examination of star clusters this, extending our observations to multiple different clusters. Because there is not sufficient time for you to observe the individual stars of each cluster, we will use some photometry that has already been provided for us. This is not an unrealistic scenario for an astronomer: because telescope time is such a precious commodity, it is common for raw data to be shared. One set of observations may provide a research group with answers to a specific question. That same data might be used again, analyzed in a different way, to provide a different group answers to an entirely different set of questions.
When we construct an H-R diagram using randomly selected stars, we expect to get a distribution of stars along the main sequence, along with scattered giants and dwarf stars. We would expect, if enough stars are observed, to see examples of almost every spectral type and luminosity class.
If we restrict our observations to related groups of stars (clusters), we expect to see something different. All of the stars in the cluster formed at the same time, but they will not all live the same length of time. Giant stars have very short lives, and can burn through their fuel in tens of millions of years. Smaller, more modest suns consume their hydrogen more slowly, and therefore live longer lives. As all stars age, they will eventually leave the main sequence, with the hottest stars disappearing first.
A cluster that has many hot, bright stars must therefore be younger than a cluster showing many cooler red stars, but few hot blue stars. Examining the distribution of the stars within the cluster can tell us the age of the cluster. Click to download the Student Manual for this exercise.
The advantage of this manual is that is provides additional detail describing the program features, but you may not need to print the entire document. A clickable link is provided on the course web, and remember that you can run these programs any time the lab LSC 174 is open.
Objectives
Since we have already taken great pains to understand how a pair of simple measurements can be translated into an H-R diagram for a star cluster, we do not need to repeat the process. This week, we will let the computer generate the H-R plot, and we will analyze the results to determine the distance and age of several different star clusters.
Your project mission is to
- Examine and analyze photometric data for multiple star clusters.
- Compare the main sequence of the cluster to a calibrated absolute magnitude main sequence, and calculate the distance to the cluster.
- Computer-model various isochrones to fit the cluster data, and determine the age of the cluster.
Procedures
To recognize how old a cluster is, we need to compare its H-R diagram to a hypothetical curve called an isochrone. An isochrone is constructed by starting with a zero-age main sequence, where you assume that all of the stars n the main sequence were born at the same time. Now advance the time, and each of the stars ages by that same amount. Re-plot the H-R curve. Some stars remain on the main sequence, but some have left it. Advance the time again, and keep doing this. As time increases, the number of stars leaving the main sequence and joining the giant branch increases as well. The farther down the main sequence that the stars have "turned off," the older the cluster:
Start Up
- Start VIREO: Double click on the icon for the VIREO program found on the desktop.
- File→Login: Enter your name and the number of the computer and click OK.
- File→Run Exercise→H-R Diagrams of Star Clusters: Choose the appropriate exercise.
- Tools → H-R Diagram Analysis: When the Color-Magnitude Diagram window opens, you will need to load the data.
- File → Load/Plot → Select Cluster Data: Choose a cluster from the list on the data table shown below. Make sure to record your data in your lab notebook in a neat table.
Zero−Age Main Sequence
- Tools → Zero-Age Main Sequence: The first step is to fit a main sequence curve to the cluster data. You will see a green curve appear, and this must be adjusted to match the data.
- Adjust the V−MV Slider: on the right until the green curve fits the data. The E (B−V) slider at the bottom has been disabled, so do not worry about this.
- Match the middle: You will not be able to get a perfect fit; the age of the cluster will affect how many stars are on the main sequence and how many have already left it. Fit the data as best possible. You will get the most accurate fit by matching the middle of the main sequence as closely as possible.
- Record the V−M: This is labeled V−MV on the slider.
|
|
Fitting an Isochrone
- Tools → Isochrones: This will place a second curve on you H-R diagram, in addition to the main sequence. This isochrone must now be adjusted to determine the age of the cluster.
- Adjust (B−V): When the Isochrone Parameters window opens, you will be able to adjust the Age slider and the Adjust (B−V) slider.
- Match the blue (leftmost) end: Since these large blue stars will leave the main sequence first as the cluster ages, the "turnoff" point on the main-sequence is a critical function of the age of the cluster. You may not see many stars on the giant branch, since giant branch stars have relatively short life spans (about 10% of their main-sequence life span), and may have disappeared already, becoming white dwarfs, neutron stars, or black holes.
- Match the dimmer (bottom) side: The stars in the main sequence of your diagram will be more scattered than the sharp isochrone line. Some of this is intrinsic to the cluster—binary stars, for instance, are brighter than corresponding single stars, and thus make the main sequence thicker. So does the fact that not all stars in the cluster are at exactly the same distance from us. There may even be a few stars included in the list that are not actually members of the cluster. Adjust your isochrone so that it runs through the points along the bottom edge of the main-sequence to avoid some of these problematic points.
- Adjust the Metallicity: This refers to the abundance of elements heavier than hydrogen. Younger clusters will have greater abundances of heavier elements than older clusters.
- Record the age: When you have a satisfactory curve fit, record the age of the cluster in Gyr (G = giga = 109 = billion).
- Repeat: Continue to fit and adjust the isochrones for the clusters on your list until you have determined the age of each.
Data
- Organize: If you have not yet, construct a neat table in your lab notebook and record your observations.
Cluster |
V−M |
Distance
(pc) |
Age
(×109 yrs) |
Notes |
NGC 752 |
|
|
|
|
M 45 |
|
|
|
|
M 41 |
|
|
|
|
M 44 |
|
|
|
|
IC 2391 |
|
|
|
|
M 67 |
|
|
|
|
M 7 |
|
|
|
|
M 39 |
|
|
|
|
- Annotate: In the Notes column, you should record secondary age values. For example, if you find that one combination of Age/Metallicity gives you a good fit, but a second, different combination gives you about as good a result, you should make a note of both potential ages.
Analysis
- Calculate: Use the computer-generated V−M value to calculate the distance to each cluster in parsecs (pc).
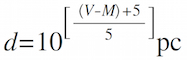
Note that this reads "ten raised to the power of" and not "ten multiplied by"
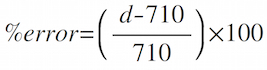
- Compare: The accepted distance to M41 is 710 pc. Calculate the percent error in your value:
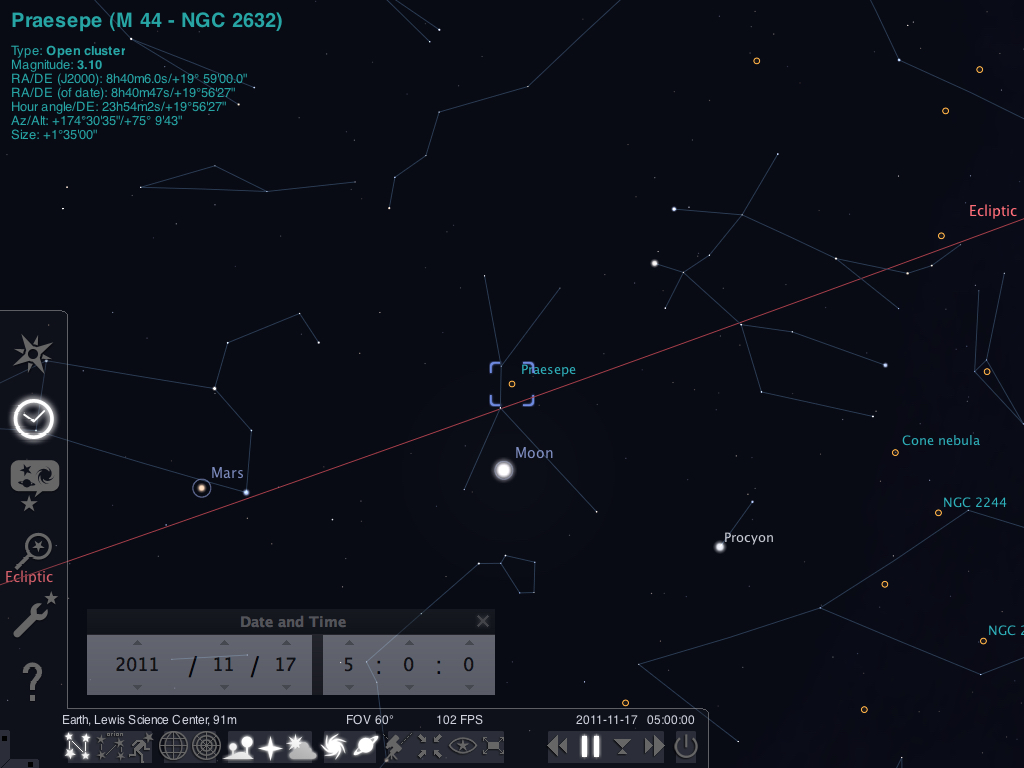
- Compare again: If the accepted age of M44 (Praesepe, or the Beehive cluster) is 600 million years (0.600×10⁹ yrs), does your value come close? Is your value high or low? Was there much uncertainty in your isochrone fitting (meaning uncertainty in your cluster age estimate)?
- Compare again, again: Examine the oldest and the youngest cluster that you have identified. Make a note of the significant differences in the appearance of the H-R diagram for each.
|